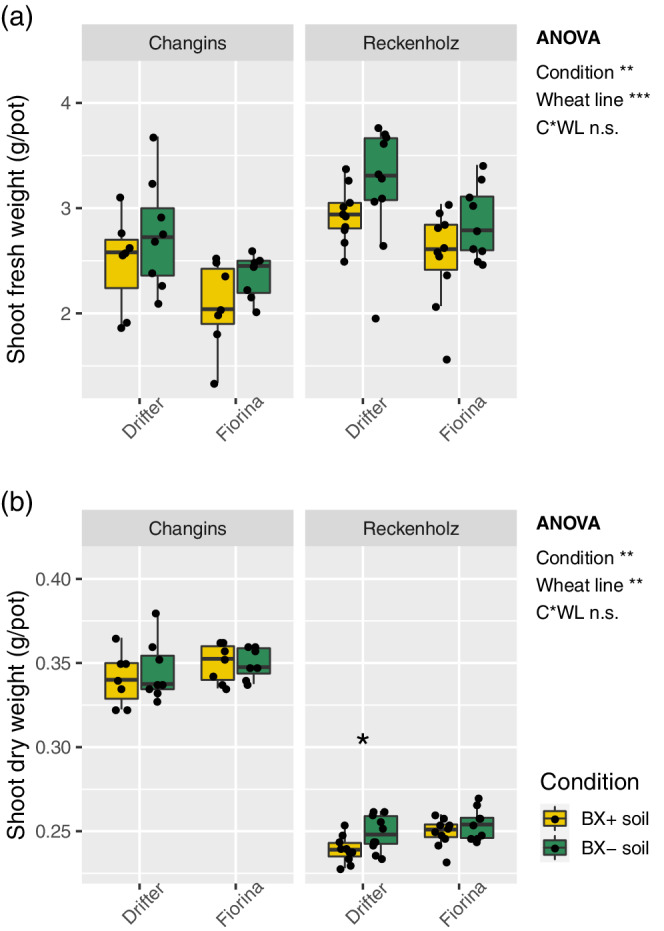
Figure 3.

BX‐feedback on wheat growth. Wheat plants were grown on ‘BX+’ and ‘BX−’ variants of Changins and Reckenholz soils. Shoot biomass was measured as (a) fresh and (b) dry weight for the two wheat lines Drifter and Fiorina after 6 weeks of growth. Data S3 documents the statistical analyses in detail. The ANOVA results (model: ~ condition [C] * wheat line [WL]) are reported next to the Figure and the pair‐wise T‐test results inside the panels (Significance code: p < .001***; p < .01**, p < .05*; not significant = ‘n.s.’) [Colour figure can be viewed at wileyonlinelibrary.com]
