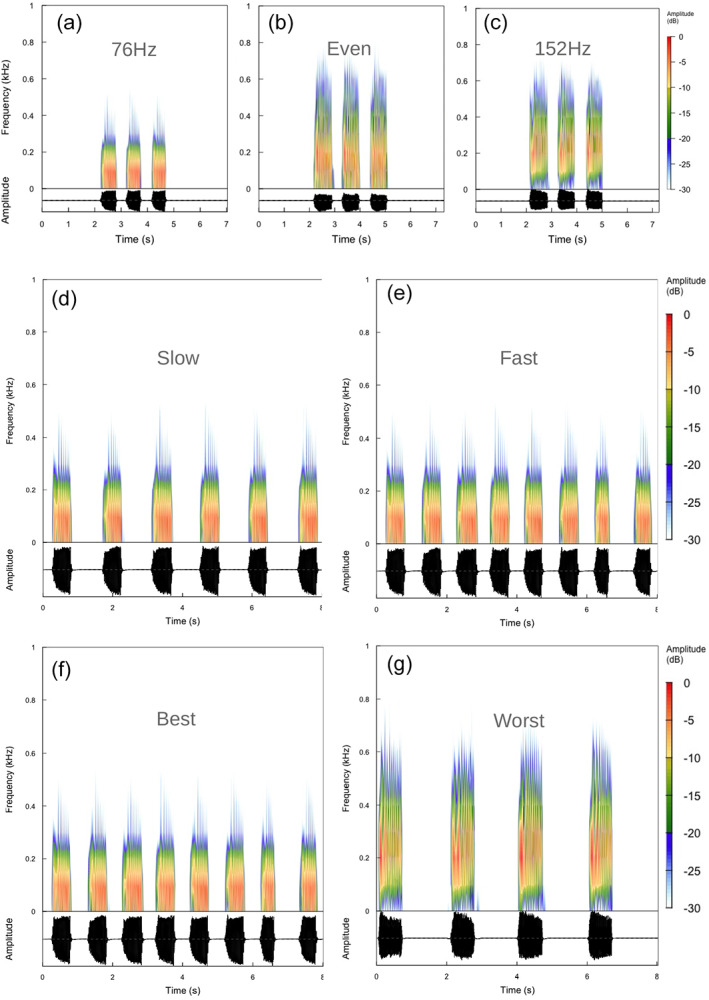
FIGURE 3.

Spectrograms (upper) and oscillograms (lower) of FS2 signals used in the playback experiments. (a) FS2‐76, peak frequency at the first harmonic (76 Hz). (b) FS2‐even, first and second harmonics are equal. (c) FS2‐152, peak frequency at the second harmonic (152 Hz). (d) FS2‐standard, PRT at 1.5 s. (e) FS2‐fast, PRT at 1.0 s; standard. (f) FS2‐Best, FS2 with 100–150 μm s−1, continuous play, 76 Hz and 1 s PRT. (g) FS2‐Worst, FS2 with 100–150 μm s−1, continuous play, 152 Hz and 1.5 s PRT.
