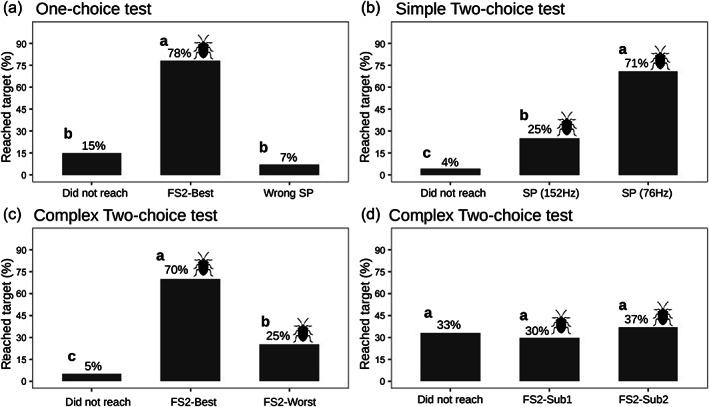
FIGURE 5.

Experiment 2: percentage of individuals that arrived at the signal emission target in each of the experiments. Silhouette of BMSB next to the percentage represents treatments in which individuals moved towards the emission of a signal. Letters (a,b and c) represent significant differences between treatments for each parameter tested.
