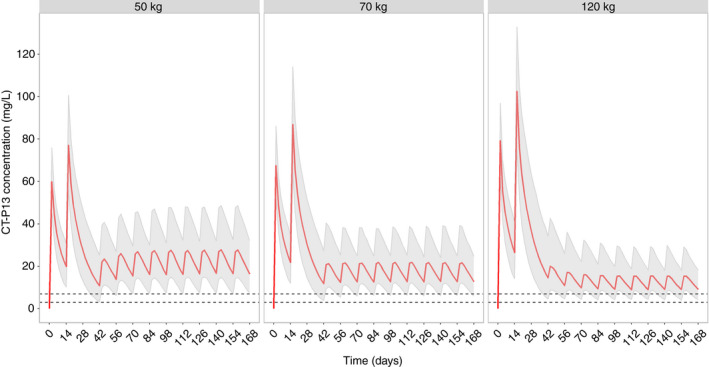
FIGURE 3.

Simulated concentration‐time profiles of CT‐P13 with intravenous induction (5 mg/kg) at weeks 0 and 2 and subcutaneous maintenance dosing with 120 mg every 2 weeks for virtual patients with body weights of 50 kg, 70 kg and 120 kg (1000 per weight group). Albumin was randomly sampled from the probability density function of albumin in the original dataset; virtual patients had no anti‐drug antibodies. Medians, 5th and 95th percentile are indicated; dotted lines denote 3 and 7 mg/L [Colour figure can be viewed at wileyonlinelibrary.com]
