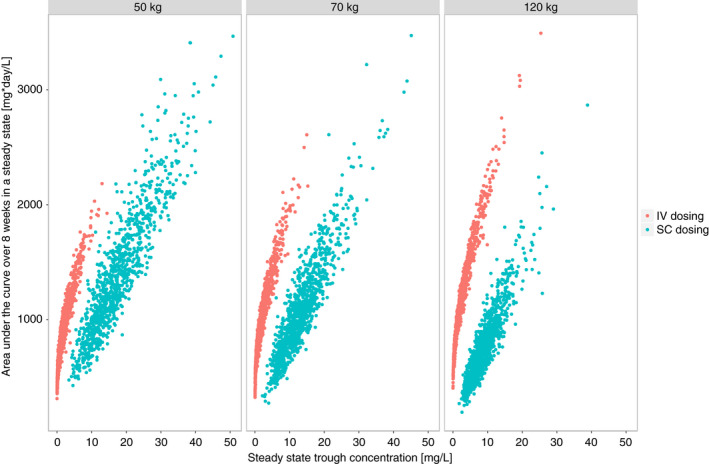
FIGURE 4.

A comparison of cumulative drug exposure expressed as the area under the curve over 8 weeks during maintenance with trough concentrations at the end of the 8‐week period stratified by weight and route of administration. Results are based on simulations with 1000 patients per weight stratum per route of administration [Colour figure can be viewed at wileyonlinelibrary.com]
