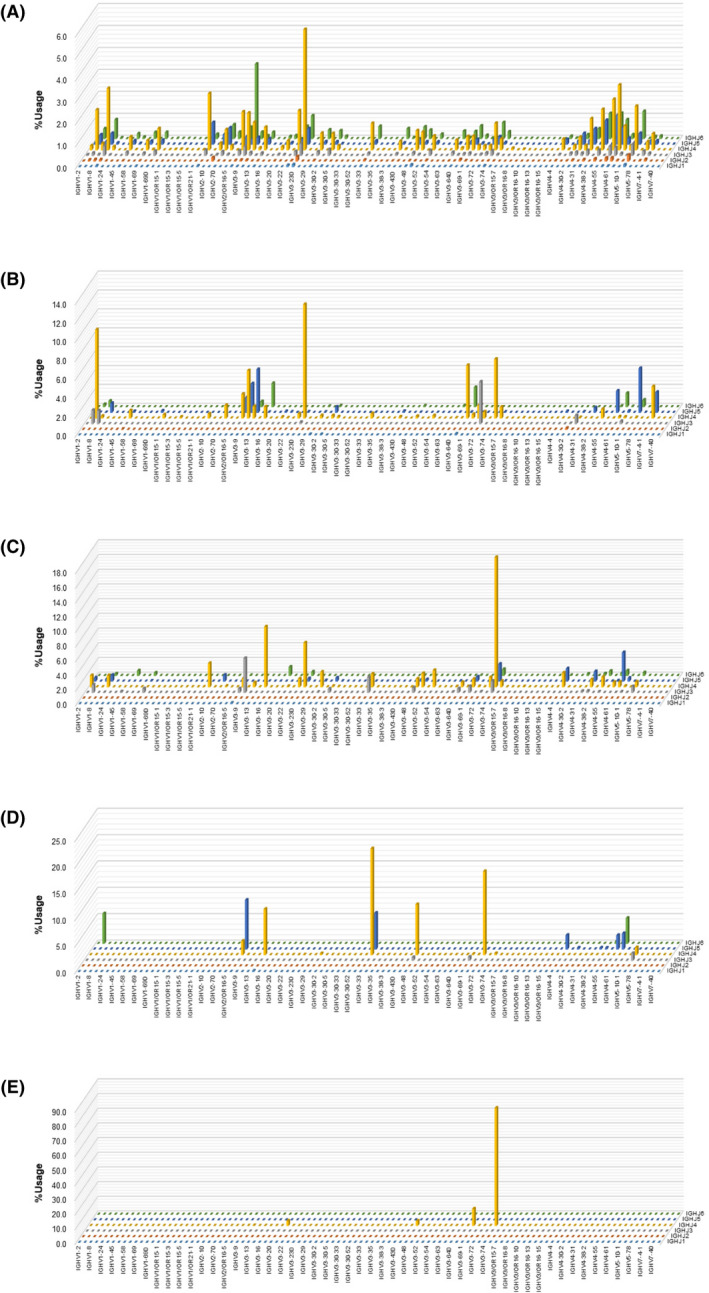
Fig 2.

Three‐dimensional graphical representation of the immunoglobulin G (IgG) heavy‐chain repertoire in peripheral blood mononuclear cells (PBMC). The x‐axis (width) and y‐axis (depth) indicate V and J genes, respectively. The z‐axis (height) represents frequencies of V–J combinations. The total of the frequencies is 100%. The IgG heavy‐chain repertoire in PBMC in adult T‐cell leukaemia–lymphoma (ATL) patients with a Shannon–Weaver diversity index (SWDI) that is in the highest (SWDI = 10·13; A), approximately 30th (5·73; B), approximately 50th (5·25; C), and approximately 70th (3·53; D) percentiles, in descending order, and that in the lowest percentile (1·02; E) are shown. [Colour figure can be viewed at wileyonlinelibrary.com]
