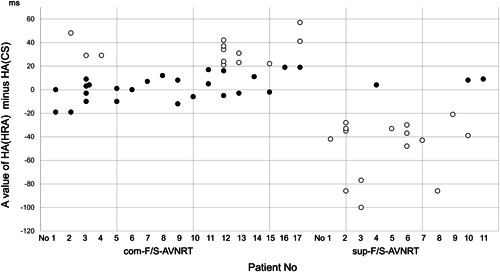
Figure 1.

Scatter plot of the HA interval after EP from the HRA (HA‐HRA) minus the HA interval after EP from the proximal coronary sinus (HA‐CS) in all EP attempts of com‐ and sup‐F/S‐AVNRT in each patient. The filled and unfilled circles represent the equal and unequal responses, respectively. AVNRT, atrioventricular nodal reentrant tachycardia; CS, coronary sinus; EP, entrainment pacing; HA, His‐atrial interval; HRA, high right atrium
