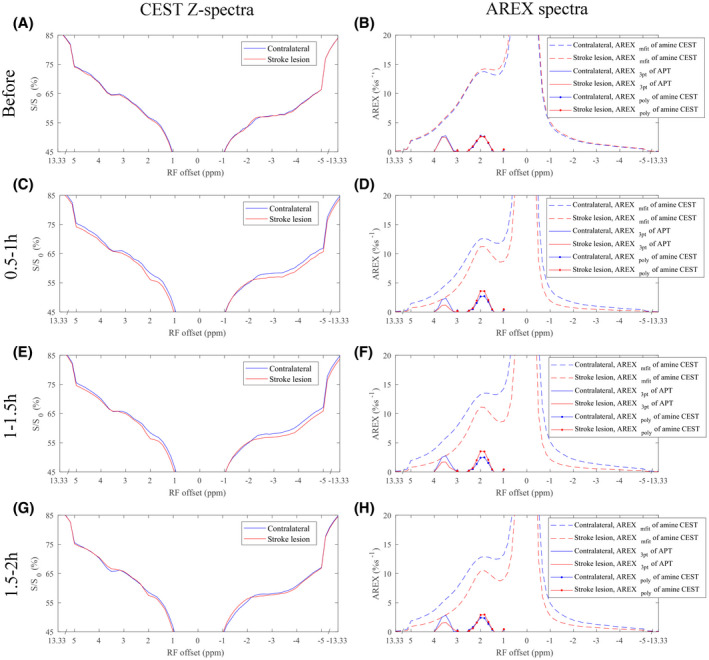
FIGURE 1.

Average CEST Z‐spectra (left column), spectra of exchange‐dependent relaxation multiple‐pool Lorentzian lineshape fit (AREXmfit) of amine CEST (dashed line), three‐point quantification (AREX3pt) fit of amide proton transfer (APT; solid line), and polynomial fit (AREXpoly) of amine CEST (dotted line) (right column) from stroke lesion (red) and contralateral normal tissue (blue) of five rat brains, respectively, acquired before (A,B), 0.5‐1 hour (C,D), 1‐1.5 hours (E,F), and 1.5‐2 hours (G,H) after the onset of stroke
