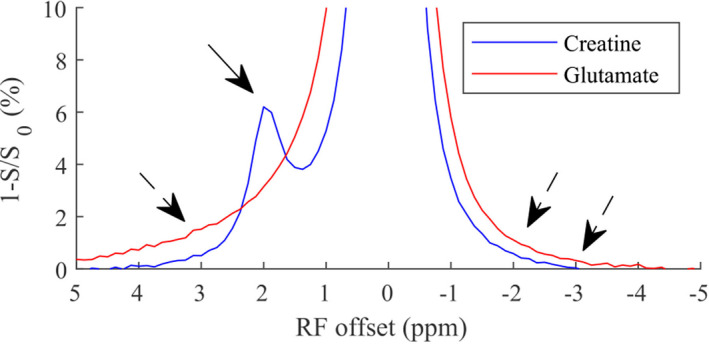
FIGURE 2.

Flipped CEST Z‐spectra (1‐S/S0) from samples of creatine (blue) and glutamate (red) with RF saturation power of 1 μT. The solid arrow indicates the narrow peak from the arginine amine of creatine. The three dashed arrows indicate the broad sloping baseline from the lysine amine of glutamate
