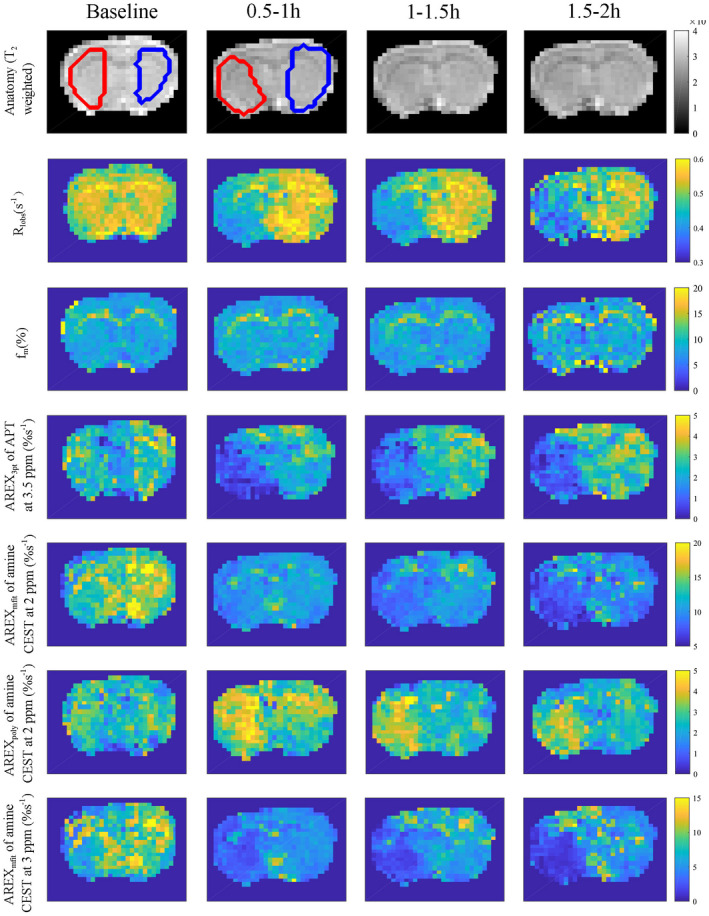
FIGURE 4.

Maps of anatomy (T2‐weighted), R1obs, fm AREX3pt fit of APT at 3.5 ppm, AREXmfit fit of amine CEST at 2 ppm, AREXpoly fit of amine CEST at 2 ppm, and AREXmfit fit of amine CEST at 3 ppm acquired at different time points before and after ischemic stroke from a representative rat brain. Regions of interest of lesion (red) and contralateral normal tissue (blue) are shown in the anatomical maps
