FIGURE 7.

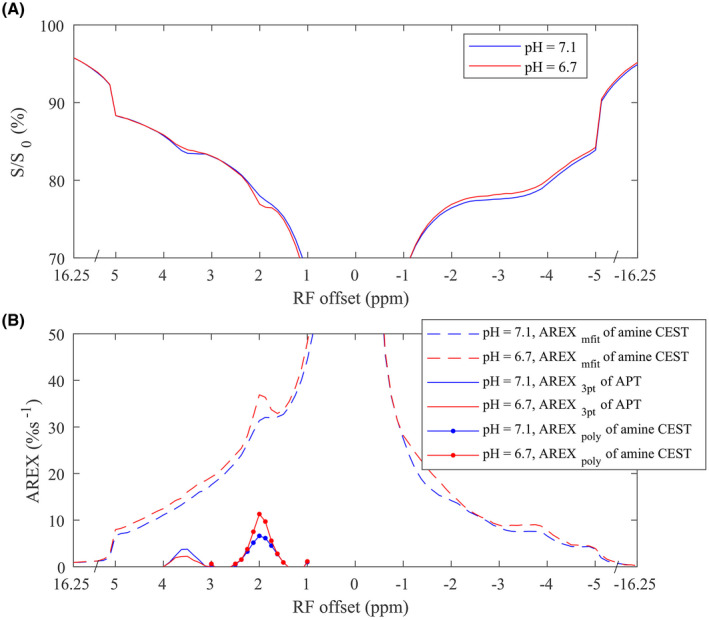
The CEST Z‐spectra (A) and corresponding spectra of AREXmfit fit of amine CEST, AREX3pt fit of APT, and AREXpoly fit of amine CEST (Bs) from two samples of tissue homogenates with pH of 6.7 (red) and 7.1 (blue), respectively

The CEST Z‐spectra (A) and corresponding spectra of AREXmfit fit of amine CEST, AREX3pt fit of APT, and AREXpoly fit of amine CEST (Bs) from two samples of tissue homogenates with pH of 6.7 (red) and 7.1 (blue), respectively