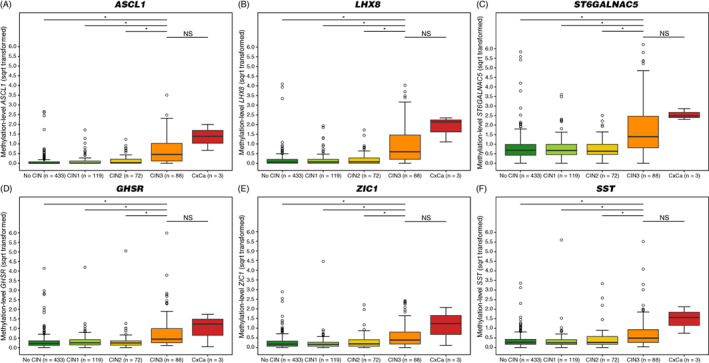
FIGURE 2.

Methylation levels increase with severity of underlying cervical disease. DNA methylation levels of (A) ASCL1, (B) LHX8, (C) ST6GALNAC5, (D) GHSR, (E) ZIC1 and (F) SST represented by the square‐root transformed Cq‐ratios (y‐axis) in the different histology categories (x‐axis). Differences between histological categories upon Kruskal‐Wallis omnibus test, followed by post hoc testing using the Wilcoxon rank‐sum test: *P‐value <.05; **P‐value <.01; ***P‐value <.001; NS, not significant. (○) Outlier sample. CIN, cervical intraepithelial neoplasia; CxCa, cervical carcinoma; no CIN, women with no histology or normal histology [Color figure can be viewed at wileyonlinelibrary.com]
