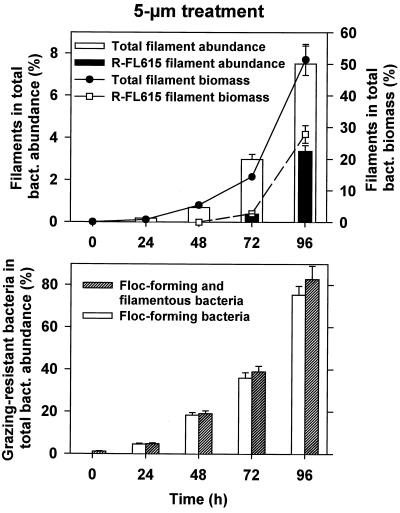
FIG. 3.
Results for the <5-μm treatment. Shown are changes in proportions of the abundance and biomass of total filamentous bacterial cells and of only filaments targeted by the R-FL615 probe in total bacterial abundance and biomass (top) and abundance of floc-forming and of total grazing-resistant bacteria (a sum of floc- and filament-forming cells) during the experiment (bottom). Values are means for three replicate treatments, and vertical bars show SDs.

