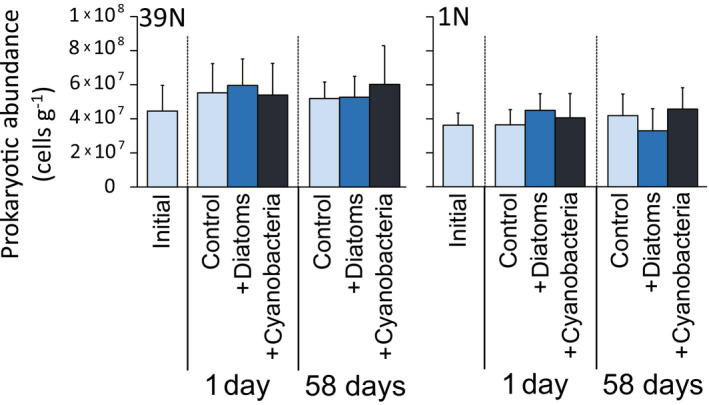
FIGURE 4.

Prokaryotic abundances in surface sediments (top 1 cm) before and after the in situ addition of diatoms or cyanobacteria at 39°N and 1°N at abyssal depths. Reported are the values for the control samples (i.e., background cores retrieved next to the in situ incubation chambers) at the start of the in situ incubation (“initial”) and during the experiments (“control”), as well as the values for the samples obtained from the in situ chambers incubated after the addition of diatoms or cyanobacteria at 39°N and 1°N. Each bar represents the average value (with error bar showing the respective SD) resulting from the analysis of three sediment cores, collected either in one of the available in situ chambers (for the “+Diatoms” and “+Cyanobacteria” treatments) or in background undisturbed sediment spots next to the chambers (for the initial and control sediments). Note that the values of prokaryotic abundance showed no statistical differences between stations, treatments, nor over time (see Table S7)
