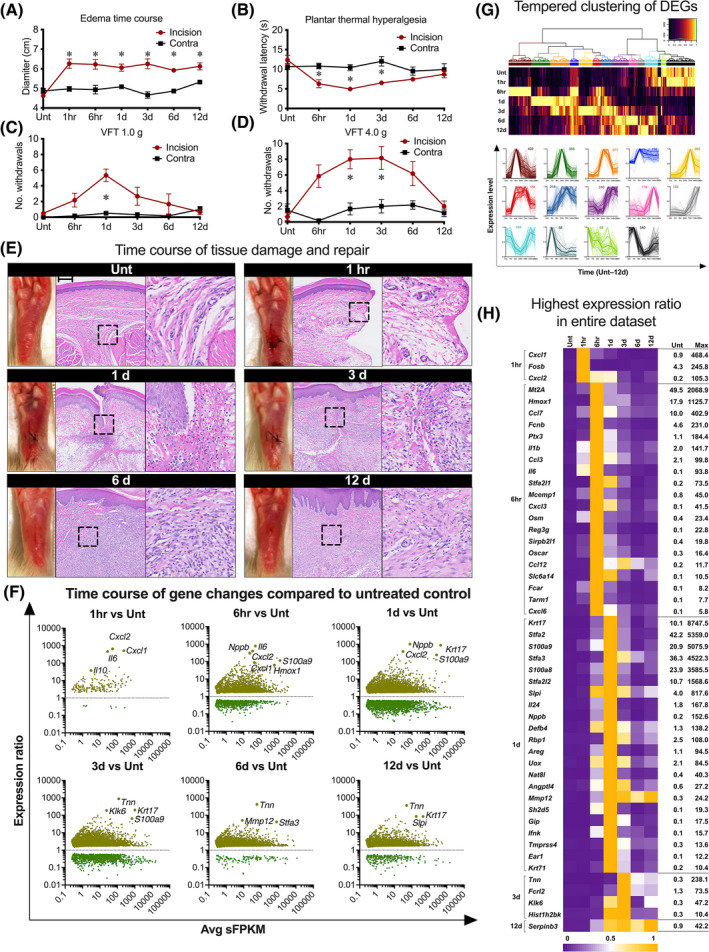
FIGURE 1.

Hind paw inflammation and overview of differentially expressed genes at each timepoint. A, Edema measured by width of hind paws in the incision side and the untreated control side. B, The withdrawal latency to thermal stimulation in the incision side and the untreated control side. C, von Frey test using 1 g hair in the incision side and the untreated control side. D, von Frey test using 4 g hair in the incision side and the untreated control side. E, Photomicrographs of hematoxylin and eosin staining of incised hind paw tissues. Black bar in the middle panel of untreated control indicates 200 μm. Right side panels in each figure are high power images of the region indicated the black dashed boxes. F, Overview of differentially increased and decreased genes at each timepoint with several representative genes labeled. For the scatter plot, the expression ratio between each timepoint and untreated control is plotted versus average sFPKM using logarithmic scales. G, Gene clusters based on temporal patterns. H, The top 50 differentially expressed genes. avg, average; d, day(s); hr or h, hour(s); Unt, untreated control; VFT, von Frey test
