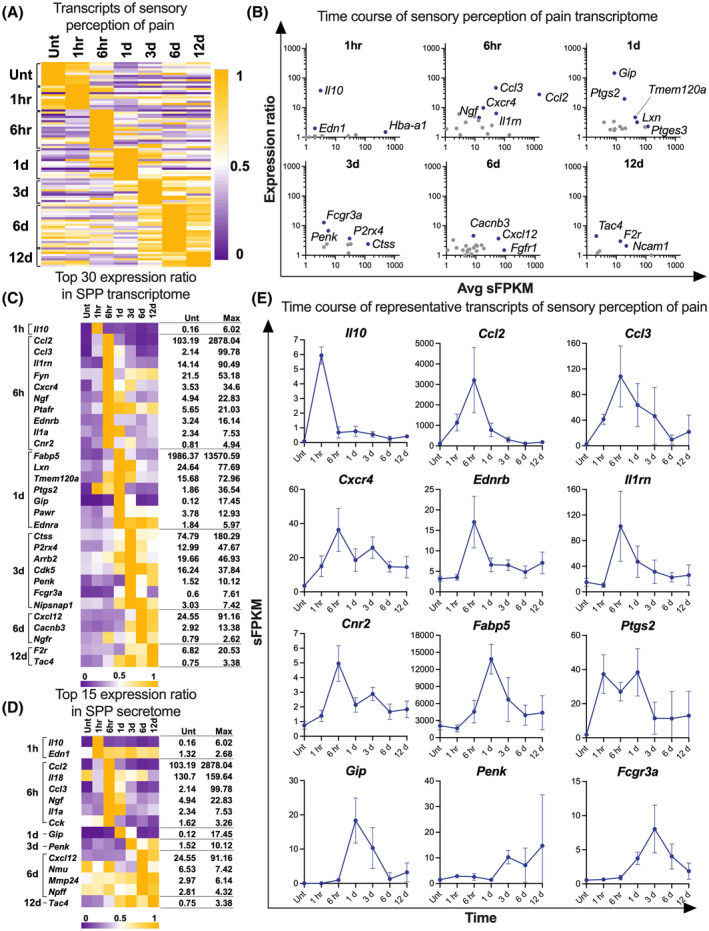
FIGURE 4.

Extraction of transcripts related to sensory perception of pain using a GO term. A, Heatmap of the transcripts related to sensory perception of pain. B, The differentially expressed genes (DEGs) in the transcripts related to sensory perception of pain at each timepoint with several representative genes labeled. For the scatter plot, the expression ratio between each timepoint and untreated control is plotted versus average sFPKM using logarithmic scales. C, The top 30 DEGs in the transcripts related to sensory perception of pain. D, The DEGs in the sensory‐perception‐of‐pain secretome. Note the temporal patterns of transcript increases in A, C, and D. E, Examples of high‐ DEGs at each timepoint. d, day(s); hr or h, hour(s); Unt, untreated control
