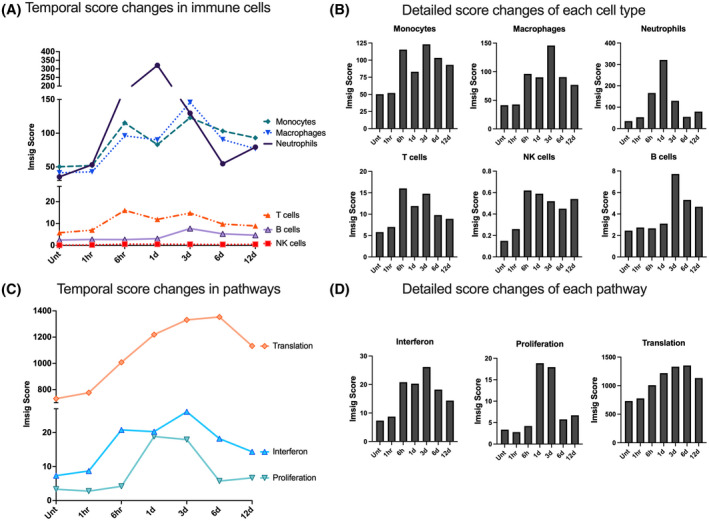
FIGURE 6.

Immune cell and pathway analysis. A, Line graphs of the time course of relative levels of different immune cell types and pathways based on gene clusters for several populations in the incised hind paw. B, The detailed Imsig scores for all the categories are plotted as bar graphs. d, day(s); hr or h, hour(s); Unt, untreated control
