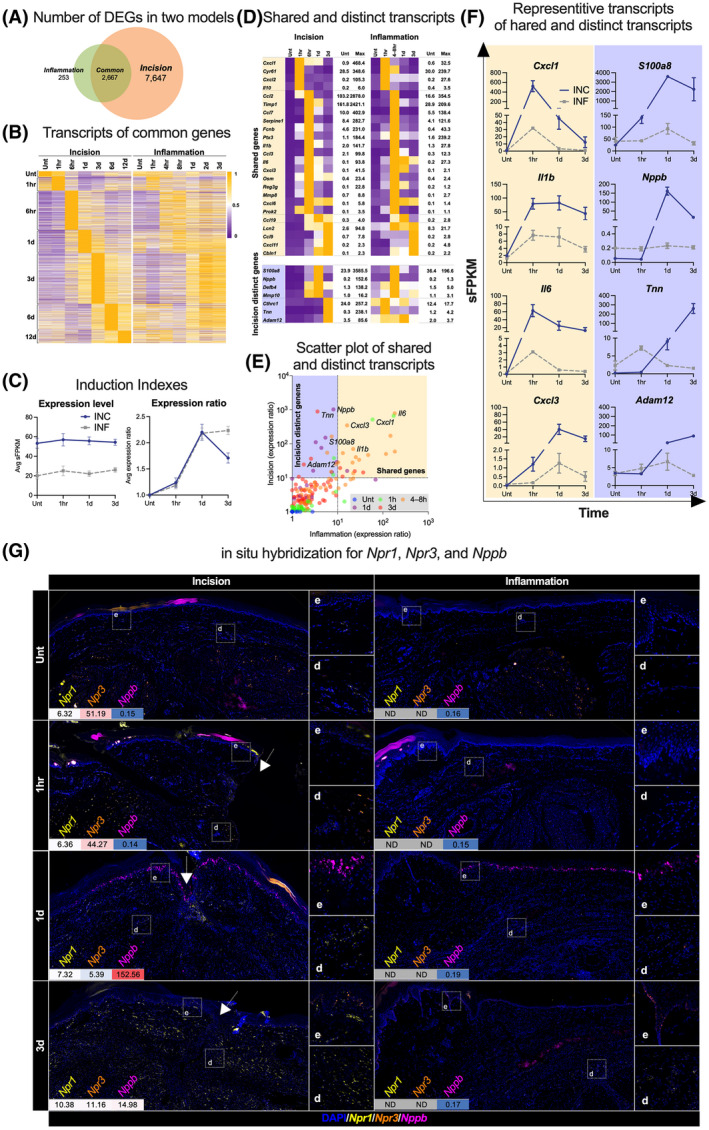
FIGURE 7.

Comparison of differentially expressed gens between the surgical incision and the peripheral inflammation models. A, The number of common and model‐specific differentially expressed genes. B, Temporally arranged heatmap of all genes in the common category in the two models. C, Induction Indexes were defined as averages of expression level in sFPKM (left) and expression ratio (right graph) in the two models. The expression level graph shows overall greater induction in the incision model. The expression ratio graph shows similar induction patterns the two manipulations, but they begin to diverge at day 3. The time course on the X‐axis goes out to 3 days because the inflammation experiment was terminated at that time. D, Some examples of genes that have overlapping temporal expression patterns between the two models (“shared genes” in right yellow background) and that have distinct temporal patterns in the incision model (“incision distinct genes” in right purple background). E, Scatter plot showing the expression ratios in the incision model plotted against the expression ratio in the inflammation model at the different timepoints. The yellow background at the right indicates the shared genes, and the left purple background indicates the incision distinct genes. Note that S100a8 is elevated in both conditions but the increase is substantially greater after incision and the specific increase in Nppb transcript in the incision model (see plots in panel F). F, Some examples of the shared genes (right yellow background) and the incision distinct genes (right purple background). G, Photomicrographs of in situ hybridization over time for Nppb (magenta), and the receptors for Nppb, Npr1 (yellow), Npr3 (orange), and DAPI (blue) in the incised hind paw (left column) compared to the inflammation (right column). The values with heatmap in the left bottom of each image show sFPKM of each target gene. Small insets at the right side of each column show high power images of epidermal layer (e) and dermal layer (d) of the boxed regions in each low power image. White arrows indicate incision sites. In four panels, the cornified epithelial layer contains some non‐specific magenta or orange fluorescence and these sites do not represent the presence of transcript. d, day(s); hr or h, hour(s); Unt, untreated control
