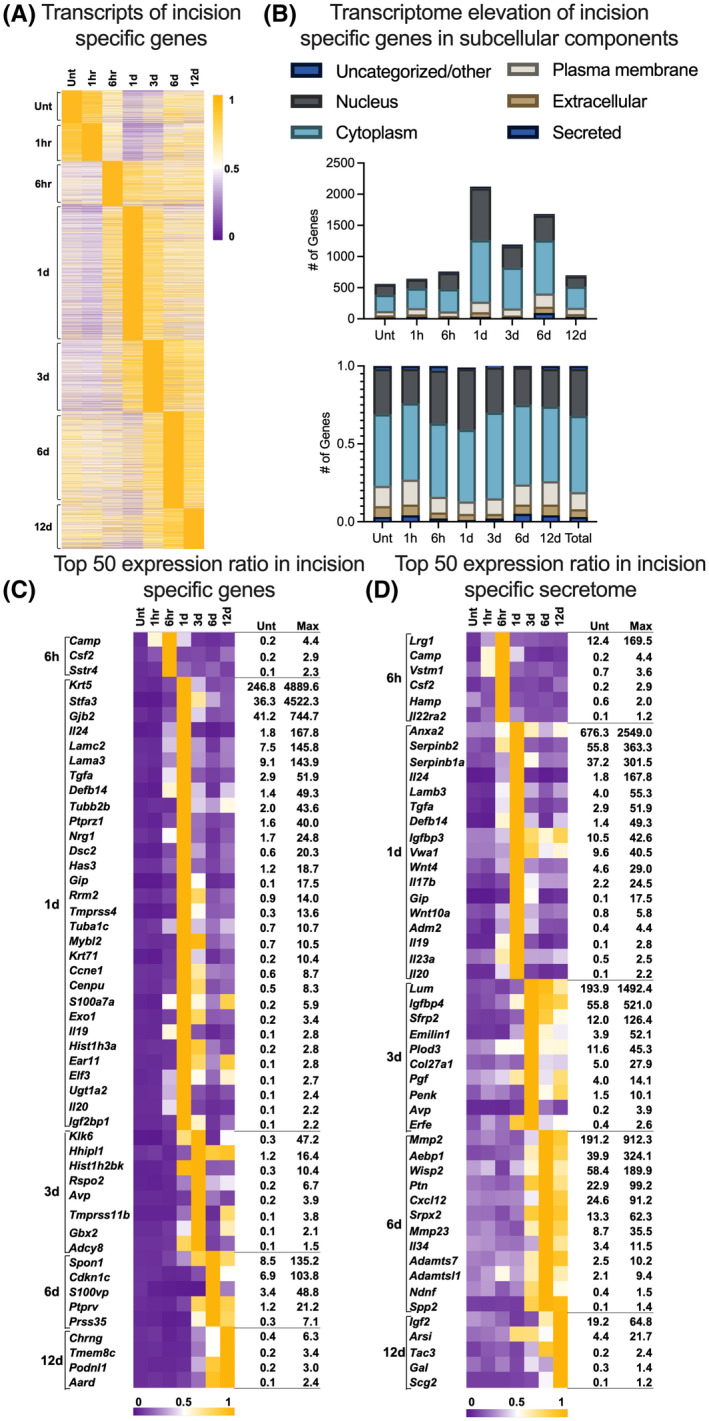
FIGURE 8.

Surgical incision‐specific differentially expressed genes (DEGs). A, Heatmap of surgical incision‐specific genes. B, The number (upper) and proportion (lower) of genes in six categories in each cluster: secreted, extracellular, plasma membrane, cytoplasm, nucleus, and uncharacterized/other. C, The top 50 incision‐specific DEGs. Seven colored boxes on the heatmap indicate each timepoint as same as in (A). D, The top 50 incision‐specific secretome. Note the temporal step wise progression of gene expression in A, C, and D. Also note that in panel C, 1 day contains the highest representation of incision specific gene regulation. Sixty percent of the genes in the figure are maximally differentially regulated at this time point. d, day(s); hr or h, hour(s); Unt, untreated control
