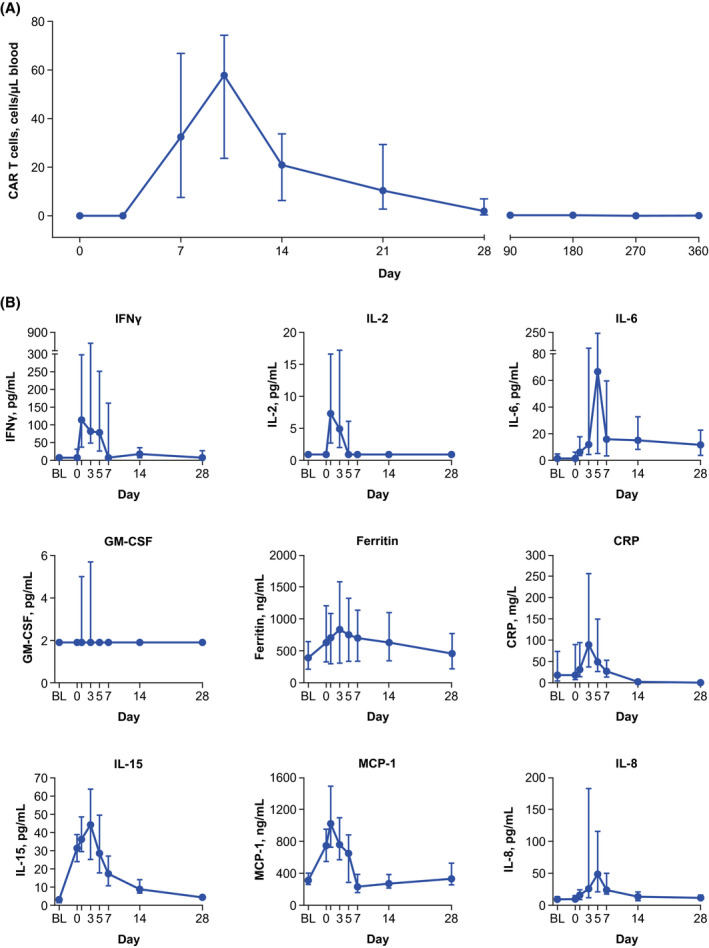
Fig 3.

CAR T‐cell expansion and key soluble serum biomarker levels over time. (A) Median (Q1, Q3) blood levels of CAR T cells over time. (B) Median (Q1, Q3) levels of key soluble serum inflammatory biomarkers plotted against time. BL, baseline; CAR, chimeric antigen receptor; CRP, C‐reactive protein; GM‐CSF, granulocyte‐macrophage colony–stimulating factor; IFN, interferon; IL, interleukin; MCP‐1, monocyte chemoattractant protein‐1.
