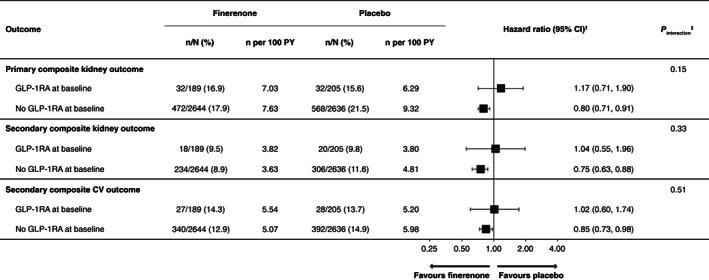
FIGURE 2.

Primary and secondary composite outcomes by baseline GLP‐1RA use. †HR (95% CI) values based on the stratified Cox proportional hazards model estimated within each level of the subgroup variable. ‡ p value (two‐sided) for the interaction of treatment group and each baseline subgroup based on the Cox proportional hazards model, including the terms treatment group, baseline subgroup and their interaction. CI, confidence interval; CV, cardiovascular; GLP‐1RA, glucagon‐like peptide‐1 receptor agonist; HR, hazard ratio; PY, patient‐years
