
FIGURE 1.
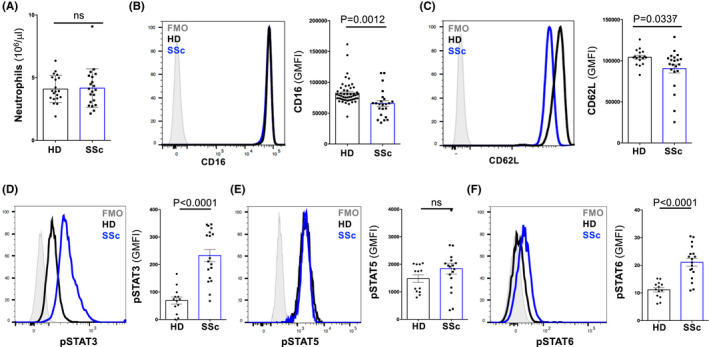
Neutrophils of patients with systemic sclerosis show signs of cytokine activation. (A) Counts of neutrophils in peripheral blood of healthy donors (HD; n = 20) and patients with systemic sclerosis (SSc; n = 21). (B–F) Representative histograms of CD16 (B; HD n = 52; SSc n = 21), CD62L (C; HD n = 17; SSc n = 21), phosphorylated STAT3 (pSTAT3; D), pSTAT5 (E), and pSTAT6 (F) in freshly isolated neutrophils of HDs (n = 13) and SSc (n = 18). Fluorescence minus one (FMO) values are represented by histograms filled with gray color. Bars represent geometric mean fluorescence intensity (GMFI) of indicated markers. Data are shown as mean ± SD. Each dot represents an independent and unrelated donor. Significance of differences between groups was calculated using Student's t‐test.; ns, not significant