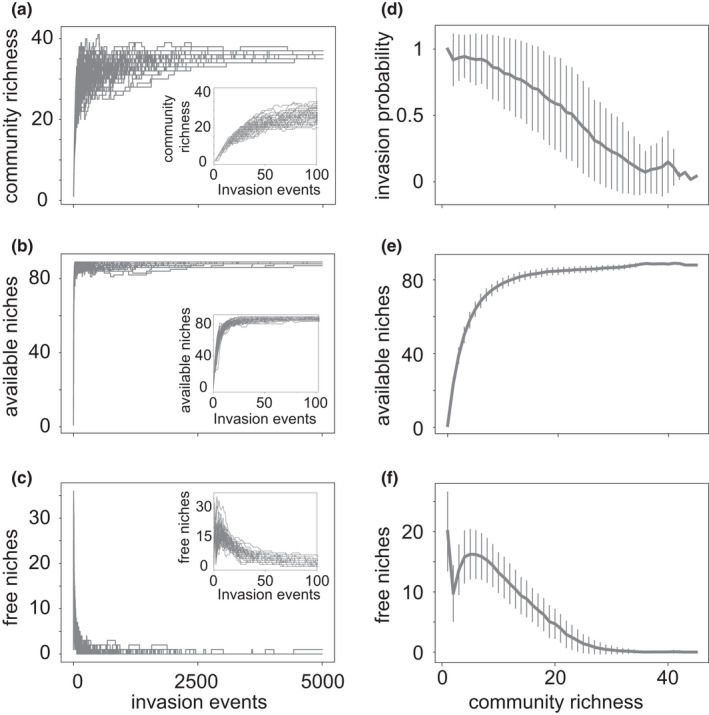
FIGURE 2.

Species and niche dynamics during community assembly. (a–c) The horizontal axis shows time (number of species invasion events) during community assembly. The vertical axes show (a) community richness (number of species), (b) number of available niches (carbon sources in the environment) and (c) number of free niches (carbon sources present in the environment and not consumed by any species in the community). The insets show the same data but for up to 100 invasions. (d–f) The horizontal axis shows community richness. The vertical axes show (d) invasion probability (number of trials before a successful invasion), (e) the number of available niches (carbon sources) and (f) the number of free niches as a function of community richness. The plots show data from 50 (a–c) or 500 (d–f) assembled communities. During assembly, each community was subject to 5000 species invasion events. Error bars in (d)–(f) indicate one standard deviation
