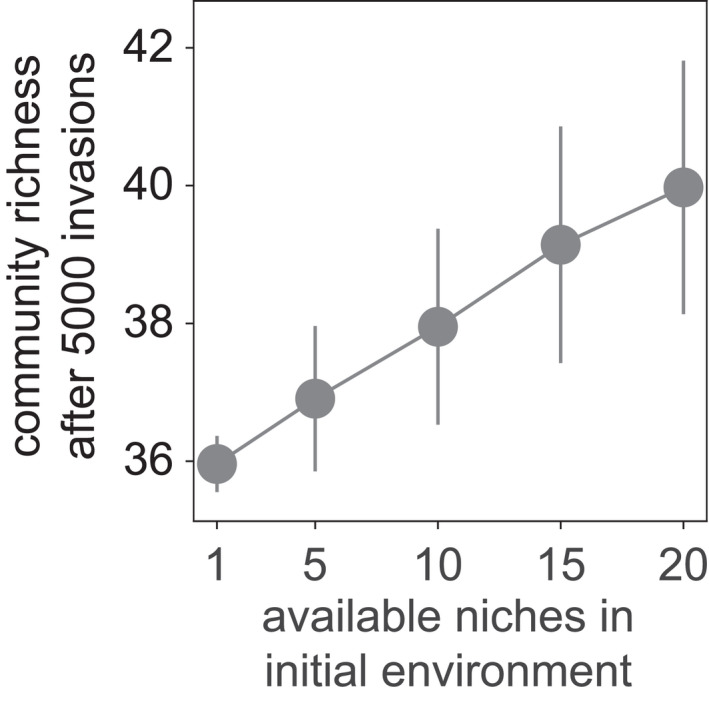
FIGURE 3.

Richer initial environments lead to richer final communities. We simulated the assembly of communities in environments that offered between one and 20 carbon sources (horizontal axis) at the beginning of community assembly. The vertical axis shows the number of species (community richness) at the end of a community assembly process consisting of 5000 species invasions. Circles show means obtained from the assembly of 500 communities. Bars indicate one standard deviation
