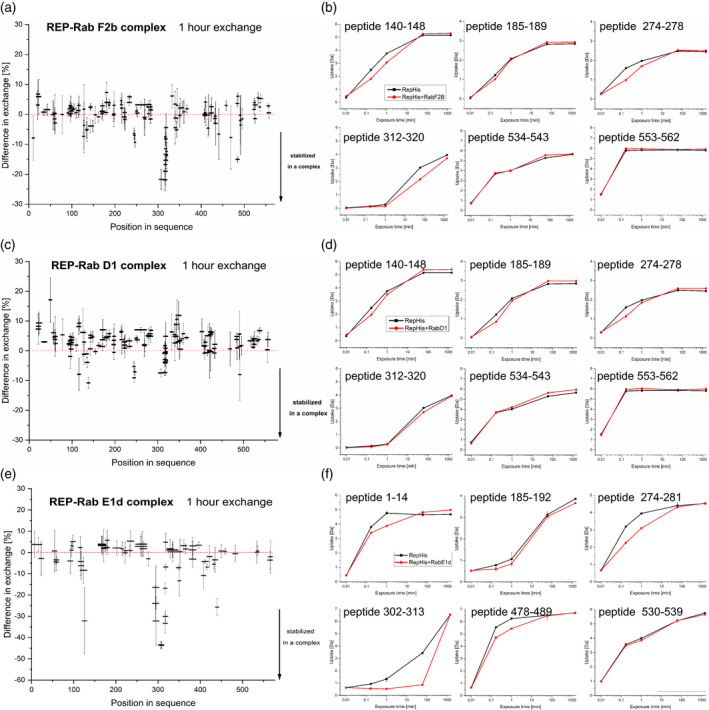
Figure 3.

HDX‐MS analysis of REP upon binding of Rab proteins.
(a, c, e) Relative difference in H‐D exchange for REP peptides upon binding of Rab proteins after 1 h incubation in D2O [%]. Horizontal bars represent individual peptides distributed along the protein amino acid sequence, vertical bars represent SD from the mean relative difference in H‐D exchange for a given peptide measured in triplicate. Minimal exchange was measured for a peptide not incubated with D2O (1 sec time point), maximal exchange was measured after 48 h of incubation. Results were recorded for REP‐His binding to (a) GST‐Rab‐F2b, (c) GST‐Rab‐D1, and (e) GST‐Rab‐E1d in the presence of GDP.
(b, d, f) Deuterium uptake by selected REP peptides upon Rab binding in a time course of 1 sec to 48 h [Da]. Each point represents the mean centroid mass of a peptide coming from protein or complex incubated in D2O ± SD. Amino acid numbers in REP peptide sequences are denoted on the graphs. Results were recorded for REP‐His binding in the presence of GDP to (b) GST‐Rab‐F2b, (d) GST‐Rab‐D1, and (f) GST‐Rab‐E1d.
