Figure 7.

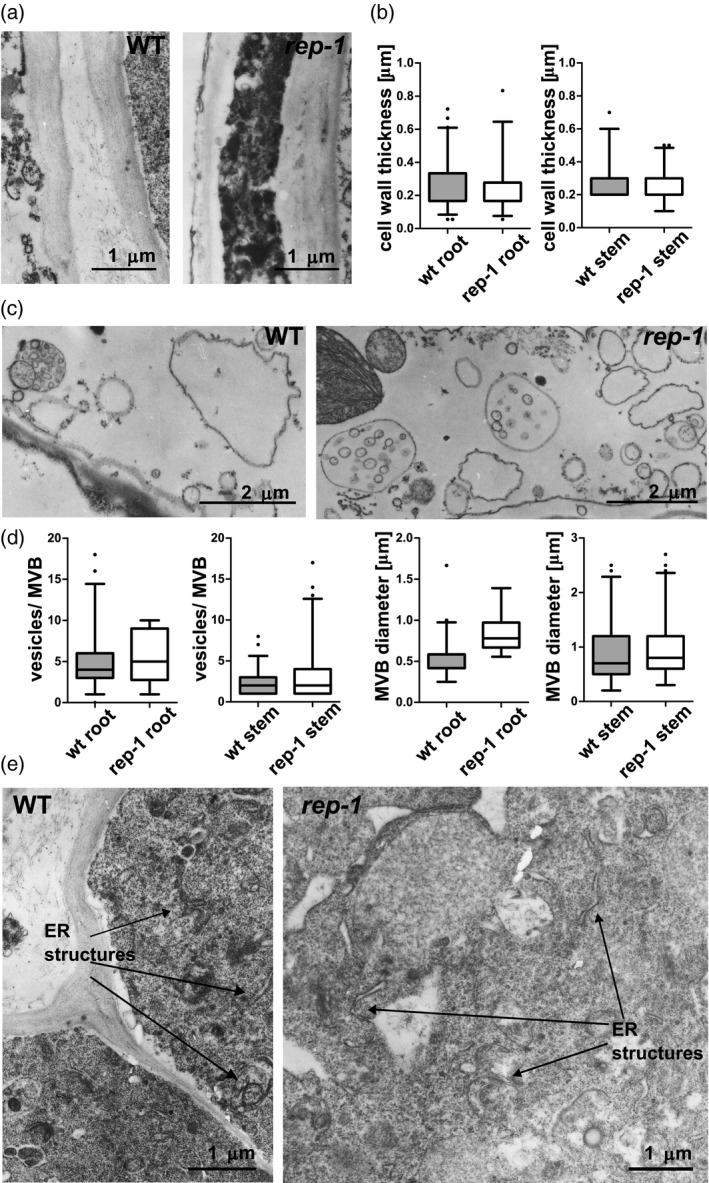
TEM ultrastructural analysis of sporophytic tissues of the rep‐1 mutant.
(a) No changes could be detected in the cell wall of root parenchymal cells. More than 20 images of four to five cells each were analyzed for each genotype. Scale bar = 1 µm for both images.
(b) Quantification of cell wall thickness in rep‐1 parenchymal root and stem cells. The mean value is marked; boxes represent 25% and 75% percentiles and whiskers represent the 95% confidence interval.
(c) Multivesicular bodies (MVBs) in stem (c) and root (d) parenchymal cells. More than 10 images of four to five cells each were analyzed for each genotype. Scale bar = 2 µm for images of stem cells (c) and scale bar = 1 µm for images of root cells (d).
(e) Quantification of MVB diameter and number of vesicles per MVB in root parenchymal cells and stem parenchymal cells of the rep‐1 mutant. MVBs in parenchymal root cells seemed more abundant and larger and contained more vesicles in their lumen in the rep‐1 mutant than in the WT. No differences in MVBs could be detected between WT and rep‐1 cells from stems. The mean value is marked, boxes represent 25% and 75% percentiles, and whiskers represent the 95% confidence interval.
(f) ER structures in root parenchymal cells do not differ between the WT and rep‐1 lines. A representative image of 5–10 electronographs is presented for each genotype.
Scale bar = 1 µm in (e).
Complementary results for other organelles are shown in Figure S9.
