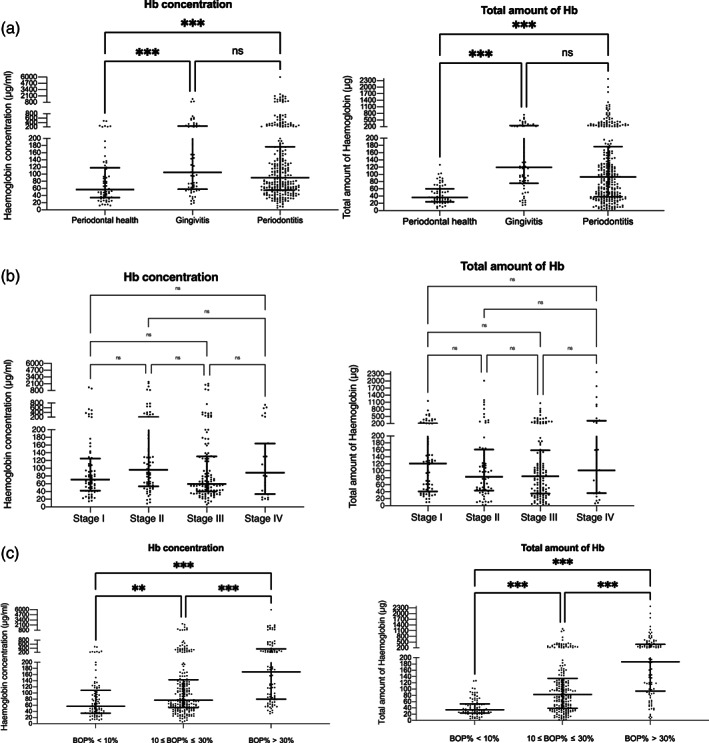
FIGURE 4.

Distribution of the concentration and total amount of Hb among different periodontal statuses. (a) Concentration and total amount of Hb with periodontal case definitions. (b) Concentration and total amount of Hb with different stages of periodontitis. (c) Concentration and total amount of Hb with gingival inflammatory status. Each dot represents one participant; the horizontal bars in each graph display the medians and interquartile ranges (IQR). Kruskal–Wallis tests were used to assess differences among groups. **p < .01, ***p < .001; ns, not significant; Stage I, Stage I periodontitis; Stage II, Stage II periodontitis; Stage III, Stage III periodontitis; Stage IV, Stage IV periodontitis
