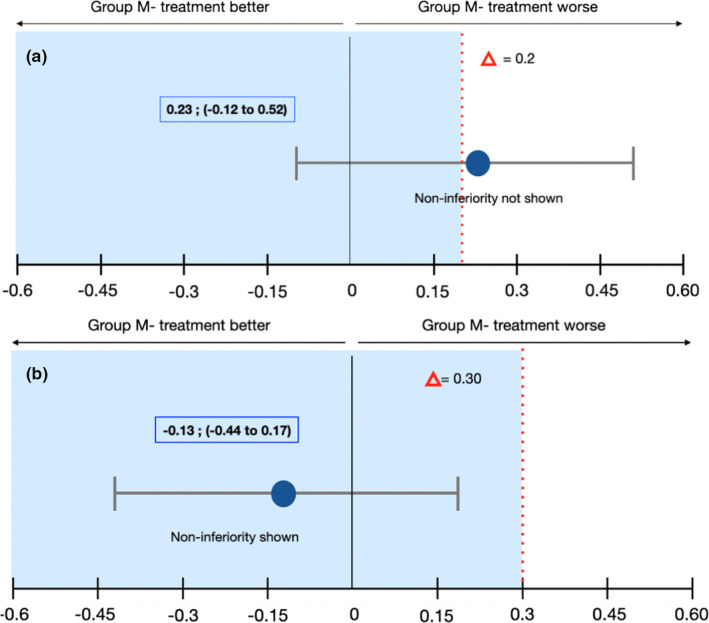
FIGURE 6.

Healing and Surgical/technical Complications: Noninferiority Analysis. Error bars indicated one‐sided 95% confidence intervals of the difference in the healing complication mean values between the M‐ and M+ groups (Mesh‐ minus Mesh+). The red broken line delineating the difference in the score shows the noninferiority margin (delta); tinted area indicates the zone of noninferiority. (a) Healing Complications: The CI includes Δ and zero and the data do not prove noninferiority of Mesh‐ group compared with Mesh+group. Although there is no statistically significant difference between the two treatments, Mesh‐ group tends to be worse than Mesh+group in terms of healing complications. (b) Surgical/technical Complications: The CI does not include Δ and the data prove noninferiority of Mesh‐ group compared with Mesh+group. Although there is no statistically significant difference between the two treatments, Mesh‐ group tends to be superior to Mesh+group in terms of surgical/technical complications [Colour figure can be viewed at wileyonlinelibrary.com]
