
Figure 3.
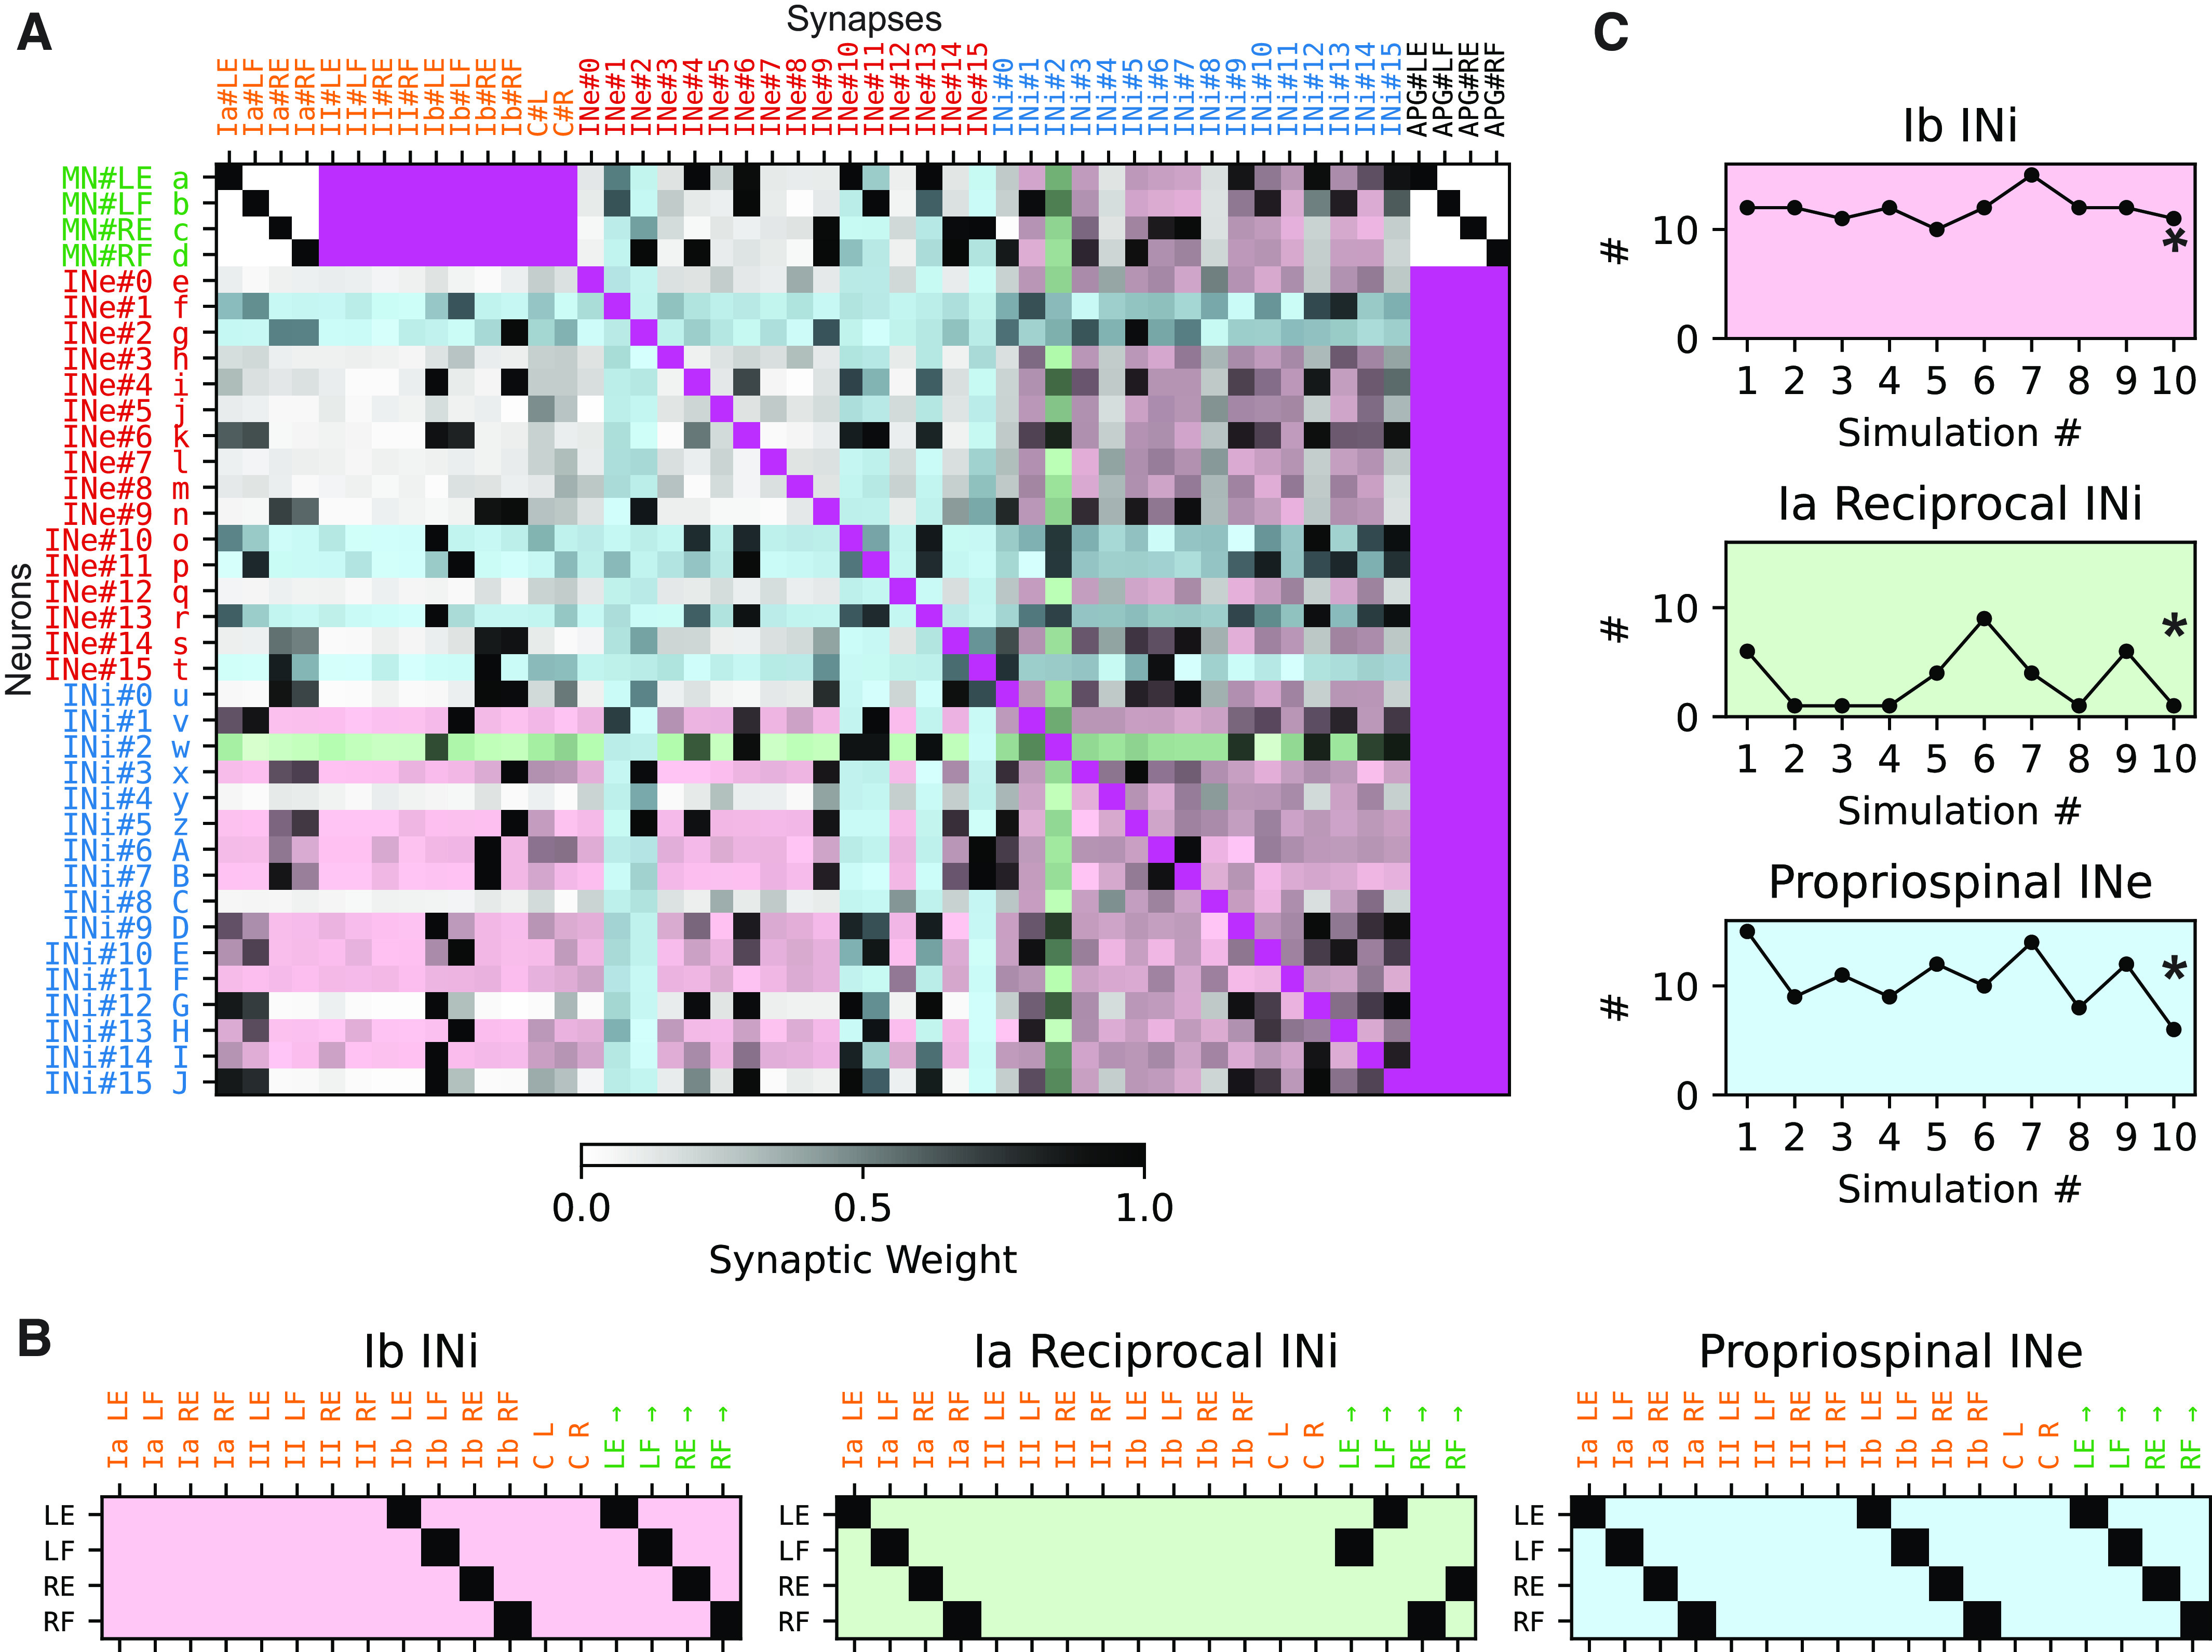
Connectivity matrix of the Oropod spinal cord following training. A: the connectivity matrix of a full spinal cord at the end of the example simulation (400,000 s). Each row indicates the synaptic input to a neuron in the neuronal network. Each row has a unique letter label a–J, used for identification in Figs. 4 and 5. Each column describes the output of a source of activity in the neuronal network. Each synaptic weight is indicated by gray scale. Archetypical interneurons are indicated by shading with the pastel color codes shown in B (both input/row and output/column). Cells that do not represent a synapse are colored a saturated magenta. B: three archetypical interneuron classes (from the literature): Ib inhibitory interneuron, Ia reciprocal inhibitory interneuron, and propriospinal excitatory interneuron, with background color key. Each row describes the connectivity of one instance of the archetype. The first 14 columns describe the prescribed synaptic input pattern, and the last four the synaptic output pattern. Thus, the archetypical Ib inhibitory interneuron for the left extensor (LE) receives input from the Ib sensor of the LE muscle and projects to the β motoneurons (βMNs) that controls the LE. C: prevalence of the three archetypical neuron classes (y-axis) across the 10 different training sessions (x-axis). The example training session is indicated with a star in each plot. INe, excitatory interneurons; INi, inhibitory interneurons; LE, left extensor; LF, left flexor; RE, right extensor; RF, right flexor.