
Figure 7.
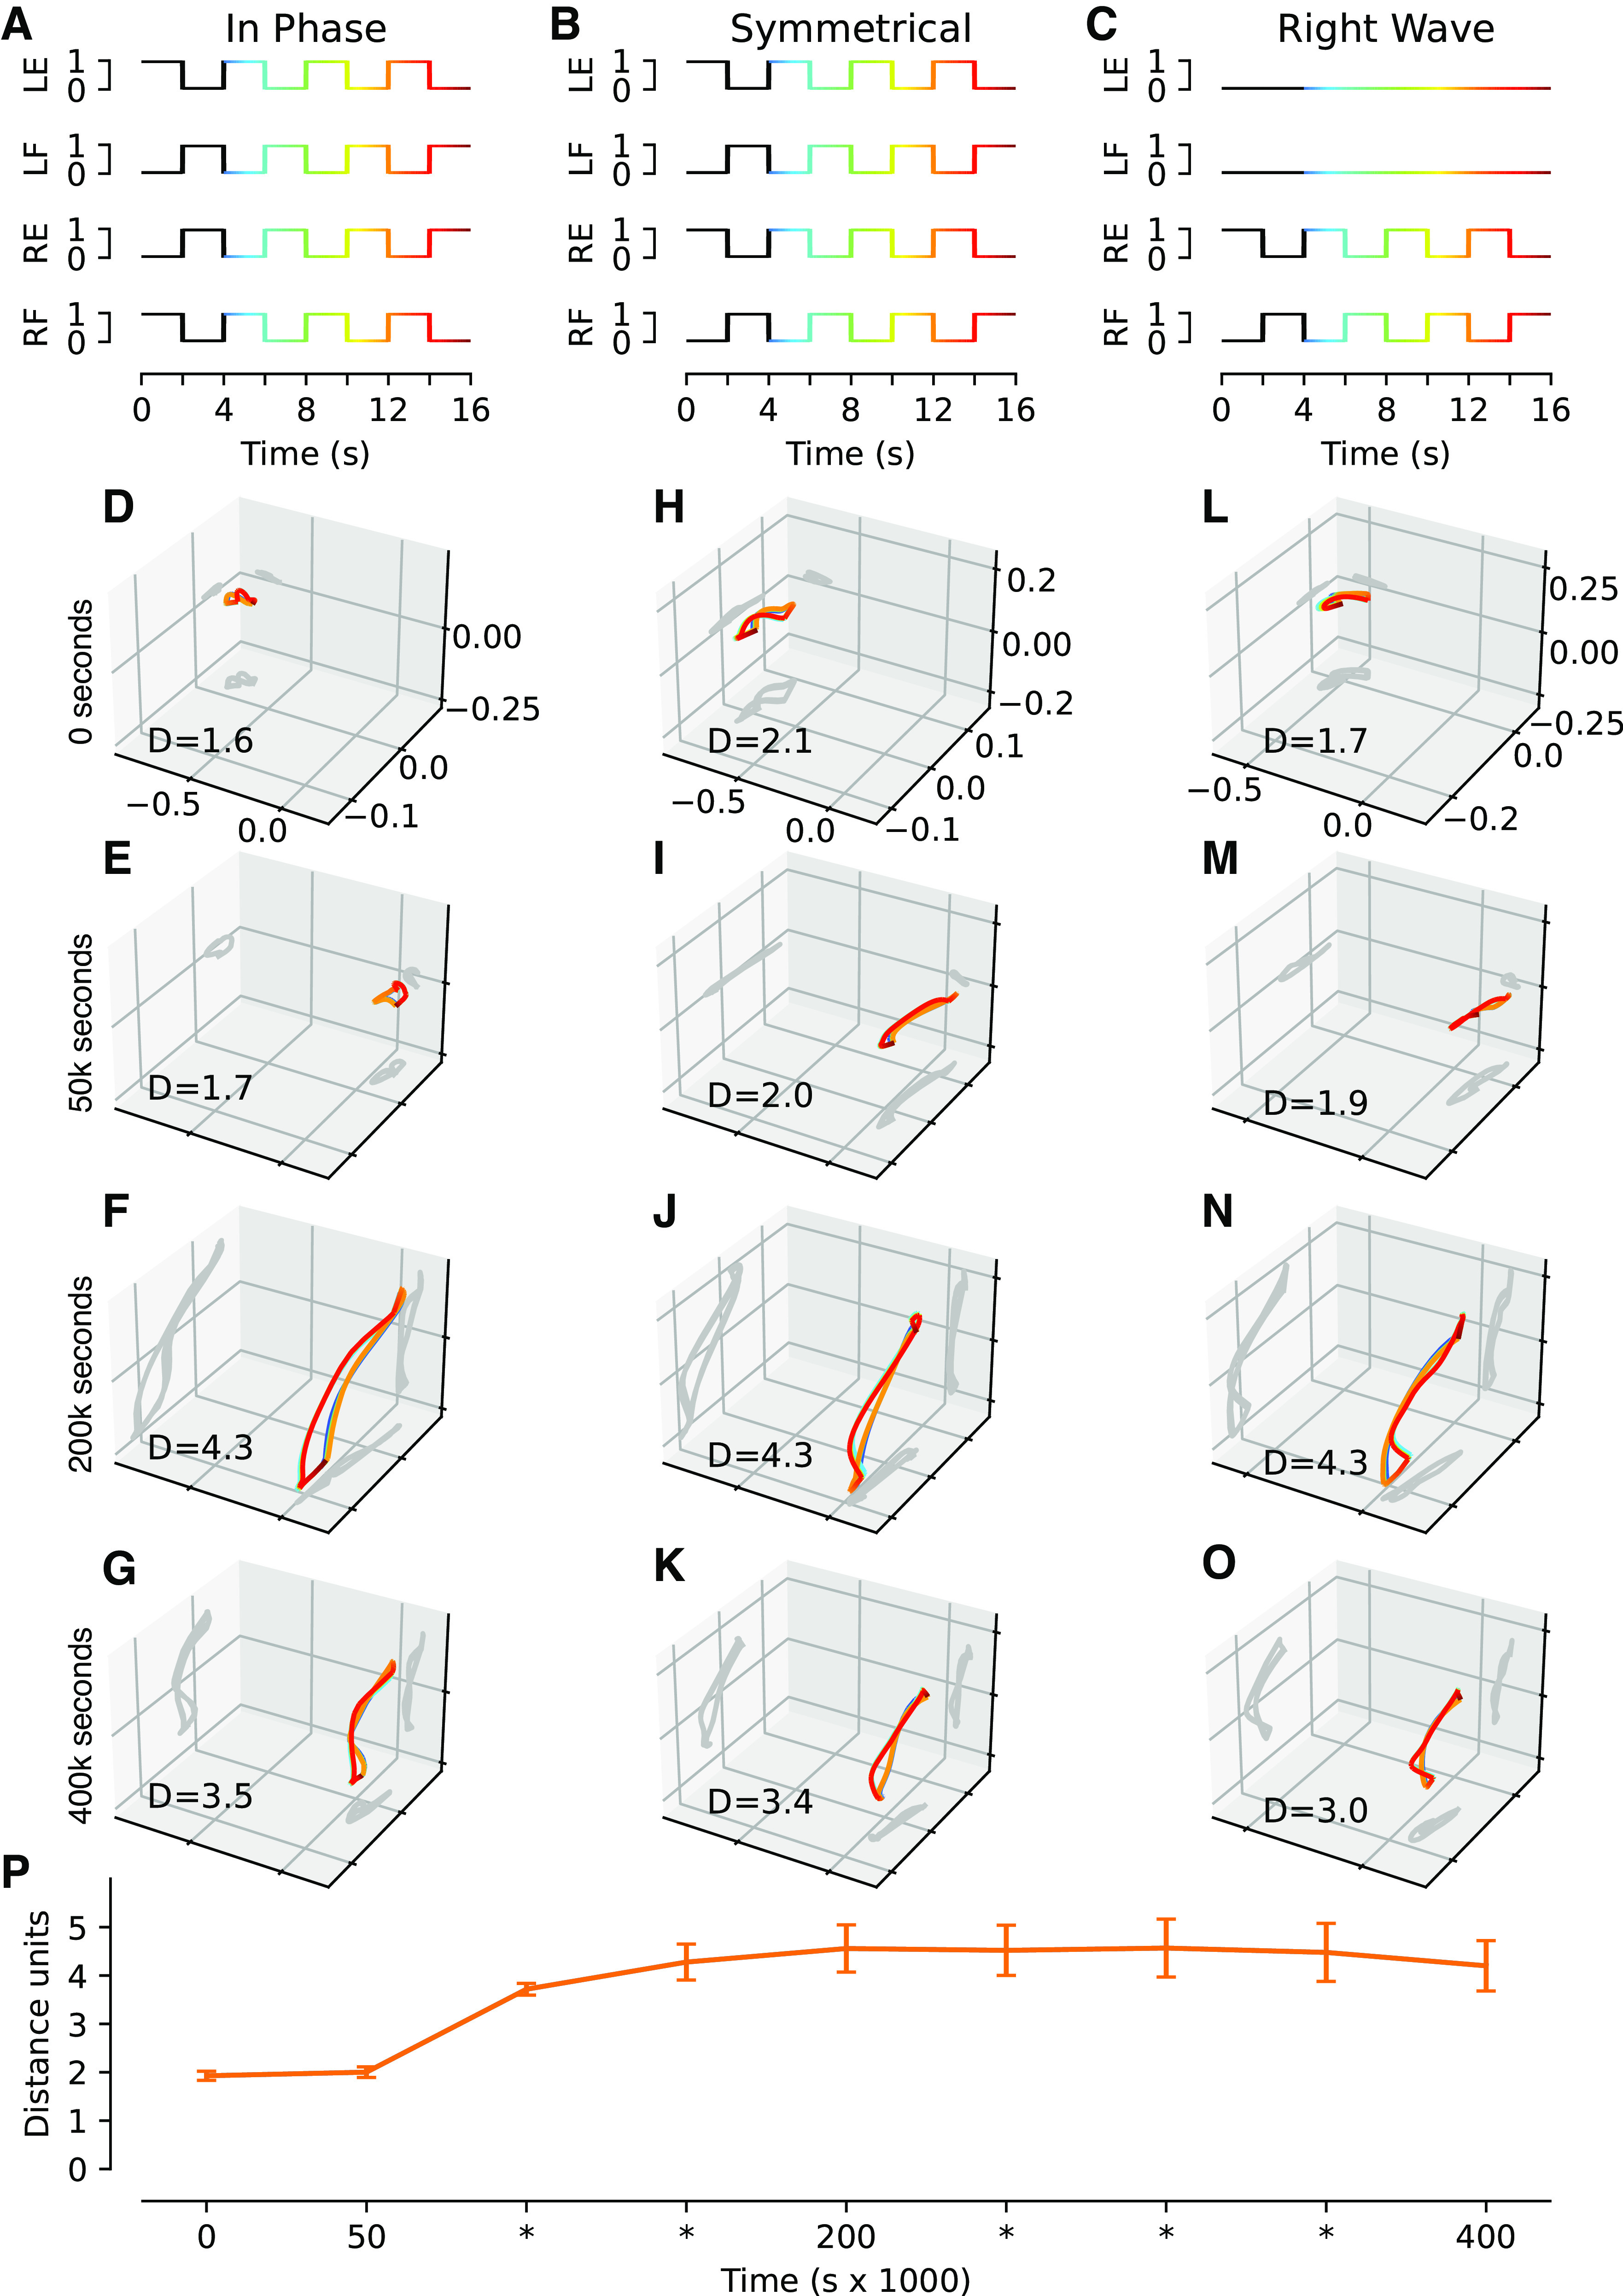
Neuronal cooperativity as assessed by principal component analysis (PCA) of the activity distribution across the interneuronal population for three different types of movements. We exercised the Oropod with predefined, phasic movements at different moments in training. The activation profiles for in phase (A), symmetrical (B), and right wave (C) movement show the activity that was injected into the activity pattern generator (APG) synapses instead of random twitches. The color gradient indicates the temporal phase of the specific movement. Each activation profile consists of three cycles of the core movement (4 s of duration), preceded by a cycle to initiate the system into a steady state (black line color in A–C). These phasic movements were not part of the training. D–O: the activity of the population of interneurons in principal components (PC) space during each of the activation profiles (one column for each movement), at four timepoints during the example training. In these plots, the interneuronal activity is reduced from 32 dimensions (one per interneuron) to the first three PCs; the corresponding 2-D projections are shown as dark gray shadows cast on their respective plane. The distance traveled is indicated for each plot. P: grand mean distance traveled in n-dimensional PC-space for all simulations across nine timepoints during training, where PC-space includes all dimensions required to account for 95% of the variance; error bars indicate SE range for all 10 simulations. LE, left extensor; LF, left flexor; RE, right extensor; RF, right flexor.