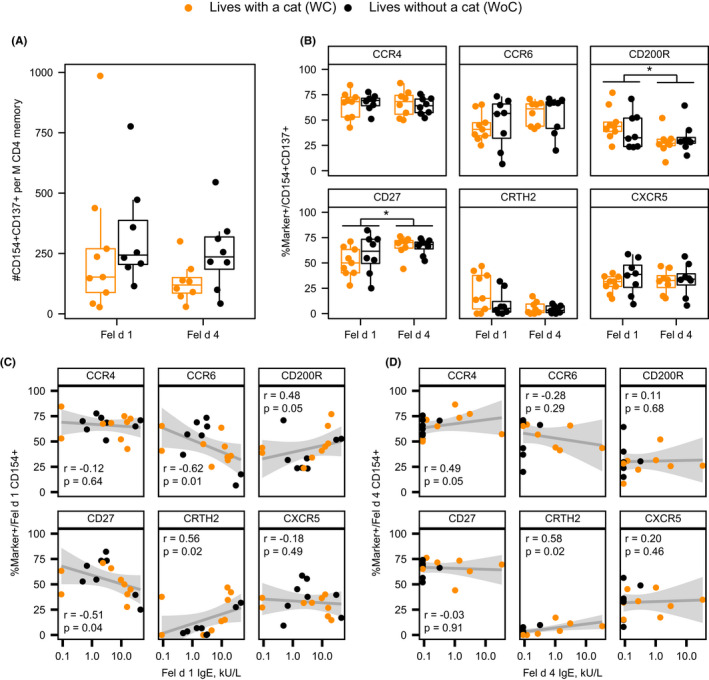
FIGURE 4.

Fel d 1 elicits a greater TH2A‐cell immune response than Fel d 4. (A) Frequency of cat‐reactive T‐cells elicited by natural Fel d 1 or recombinant Fel d 4. (B) Expression of CD154+ T‐cell marker subsets. (C) Correlation between CD154+ T‐cell markers and Fel d 1‐specific IgE. (D) Correlation between CD154+ T‐cell markers and Fel d 4‐specific IgE. Grey areas in C and D represent the 95% confidence bands for a linear fit. Mann‐Whitney U‐test conducted for comparisons between groups (panels A and B) as well as for comparison between Fel d 1 and Fel d 4 (panel B). Spearman correlation coefficients are presented in panels C and D
