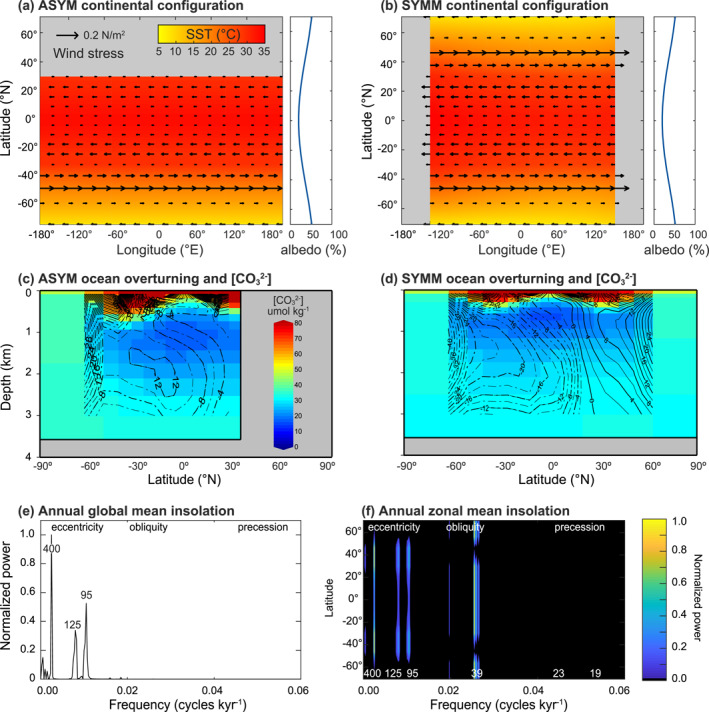
Figure 1.

cGENIE configurations. (a and b) The continental landmass distribution (gray), prescribed wind stress fields (vectors), albedo profiles, and simulated sea surface temperature (SST, color coded) for (a) the asymmetric configuration (ASYM) and (b) symmetric configuration (SYMM). (c and d) The zonal mean ocean overturning strength indicated by contour lines, dashed for a counter‐clockwise circulation, solid lines for clockwise movement. Carbonate ion (CO3 2−) concentrations for (c) ASYM and (d) SYMM are color coded. The bottom panels include normalized power spectra for (e) the annual global mean insolation and (f) the annual zonal mean insolation.
