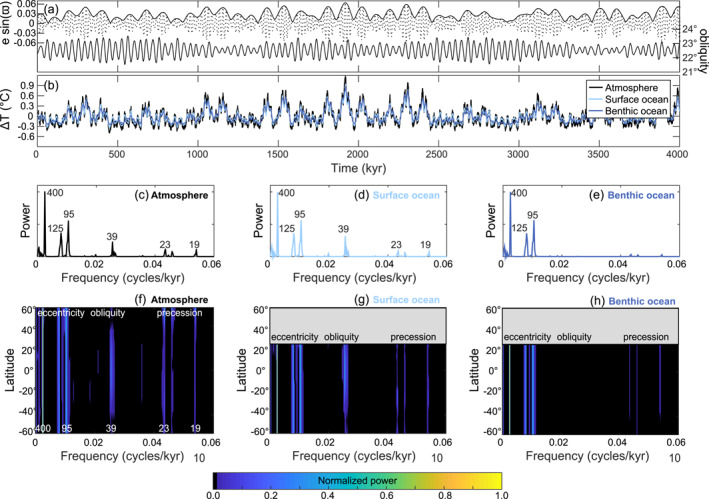
Figure 2.

Astronomical climate evolution in asymmetric configuration (ASYM) of Exp.0. (a) The eccentricity, obliquity, and the precession index (e sin ϖ) used to calculate the daily mean insolation across 4 million years of cGENIE simulation. (b) The simulated change in the global annual mean temperature in the atmosphere (black), surface (light blue), and benthic ocean (dark blue) with their respective normalized power spectra in panels (c–e) calculated using the Fast Fourier Transform. Each value near a spectral peak indicates the associated period of the cycle in kyr. The power spectra of temperature in the (f) atmosphere, (g) surface, and (h) deep ocean are shown for each latitude.
