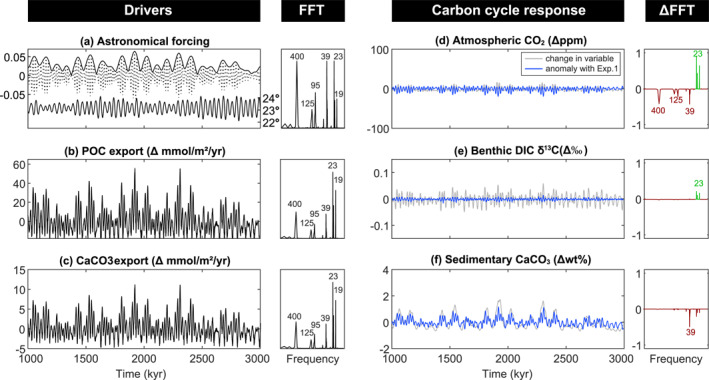
Figure 4.

Exp.2, marine surface productivity feedback in asymmetric configuration (ASYM). (a) Astronomical forcing parameters (as per Figure 3a). (b) Change in the export of particulate organic carbon. (POC). (c) Change in the export of CaCO3. (d) Change in atmospheric CO2. (e) Change in benthic δ13C of dissolved inorganic carbon (DIC). (f) Change in wt% CaCO3. All variables are annual global mean values and are accompanied by their respective Fast Fourier Transforms (FFTs), normalized to the peak with maximum power. In blue, the values are plotted as anomalies with the previous experiment and depict the change driven by the marine productivity feedback only. Likewise, the FFTs are plotted as anomalies. A positive (green) value on the y‐axis indicates an increase in relative power and a negative (red) value indicates a decrease in relative power compared to the previous experiment.
