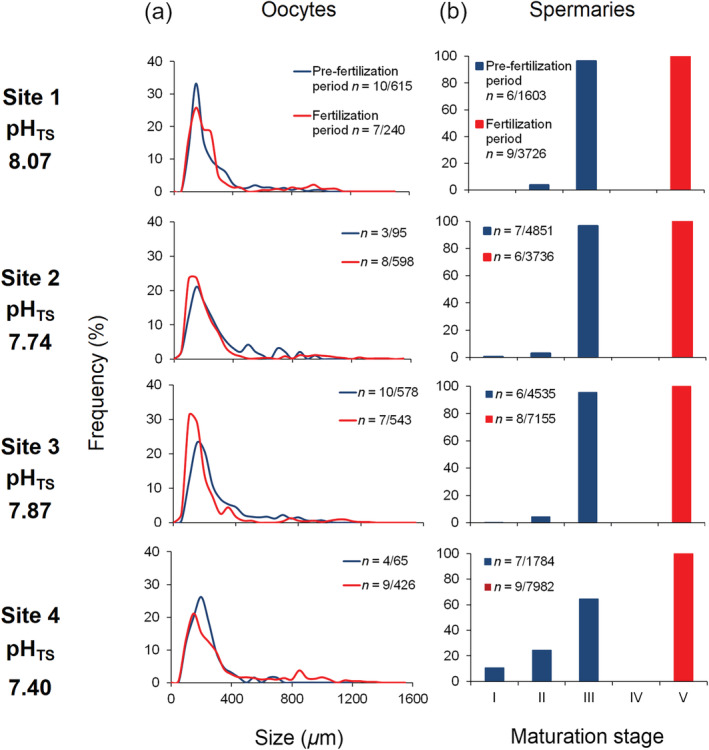
Fig. 2.

Oocyte size and spermary maturation stage distributions. (a) Distribution of oocyte size during the pre‐fertilization (blue line) and fertilization (red line) periods. n = number of polyps/oocytes. (b) Distribution of the five spermary maturation stages during the pre‐fertilization (blue histogram bars) and fertilization (red histogram bars) periods.
