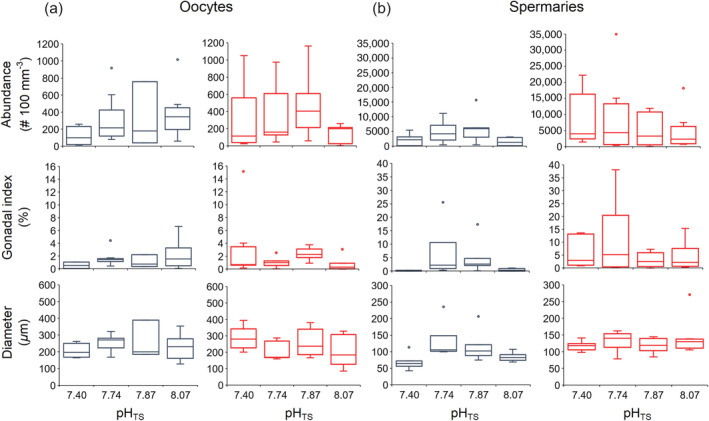
Fig. 3.

Oocyte and spermary reproductive parameters. Boxplots of oocyte (a) and spermary (b) abundance, gonadal index, and diameter in the pre‐fertilization (blue) and fertilization (red) periods. The box indicates the 25th and 75th percentiles, and the line within the box marks the median. Whisker length is equal to 1.5× interquartile range (IQR). Circles represent outliers.
