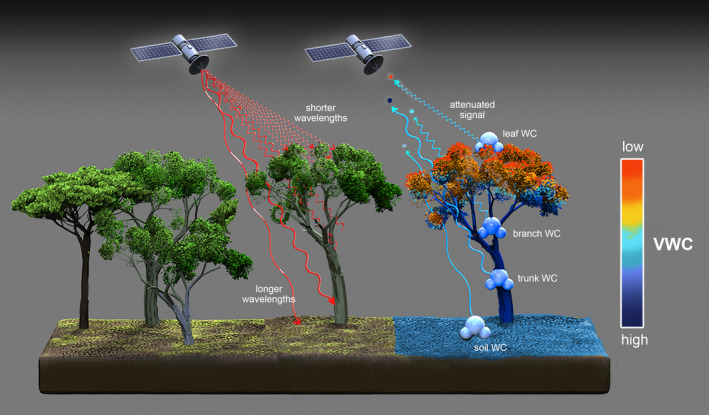
FIGURE 3.

Microwave remote sensing is able to observe water content in forests. The canopy layers represented in each measurement (the penetration depth) varies across different microwave frequency bands (and thus different wavelengths), as show through different red and blue electromagnetic waves. Observations represent deeper areas of the canopy as wavelengths increase (and frequencies decrease) from Ku‐band across X‐, C‐, and L‐bands to P‐band. Higher frequencies are most sensitive to leaves and branches while lower frequencies also have increasing sensitivity to trunks and soils. Red waves represent transmissions on a radar system while blue waves represent the returns, with dots at the end of each wave representing different magnitude backscatter coefficient measurements depending on the water content (colorbar) of the different vegetation components each wavelength is sensitive to. If only the blue waves are considered and the dots are interpreted as measurements of VOD, the figure is representative of a radiometer system instead
