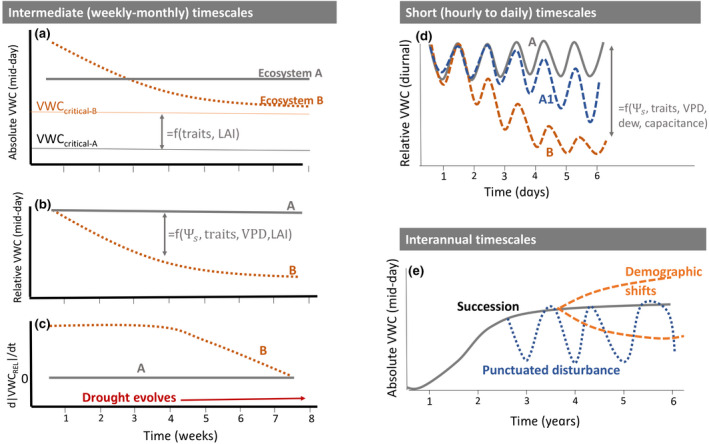
FIGURE 4.

What can vegetation water content tell us about plant stress? The absolute value of VWC (panel a, shown as mid‐day values) is difficult to interpret without context about its maximum and critically limiting values (e.g., the VWCcritical). For example, while Ecosystem B initially has higher absolute VWC than Ecosystem A, its VWCcritica is also higher. When VWC is expressed as a relative value compared to the seasonal maximum (panel b), Ecosystem B emerges as consistently more stressed than A, with the difference between the two reflecting traits, structure, as well as environmental states (soil water potential, VPD). The time derivative of relative VWC (panel C) illustrates that the time change in VWC can be zero for both very stressed and very unstressed ecosystems, but the change in d|VWC|/dt over periods of weeks to months is highly informative of the ecosystem water status. On the right side, panel (d) shows differences in the diurnal amplitude of relative VWC for ecosystems experiencing little stress (A), intermediate (A1), and more severe stress (B). Panel (e) shows long‐term (interannual) changes in absolute VWC attributable to succession, disturbance, and demographic shifts
