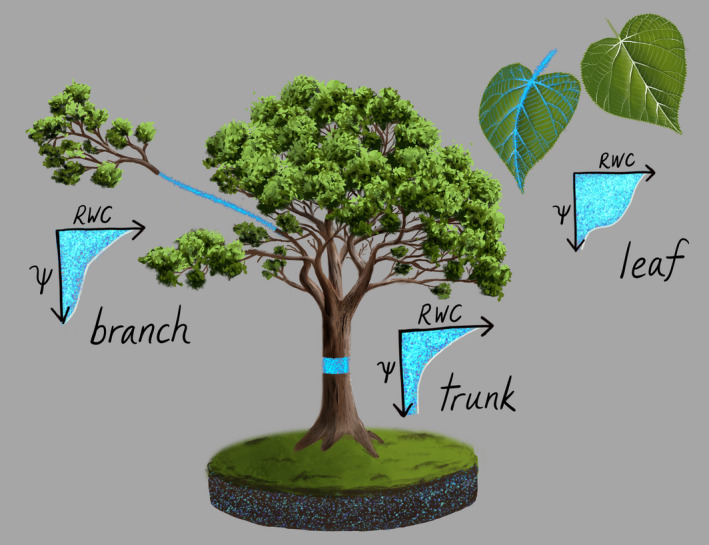
FIGURE 5.

Vertical distributions of tissue‐specific water retention properties (RWC – Ψ curves), biomass, and sensor penetration depth all jointly determine remotely sensed water content and its temporal variation. Several hypothesized curves delineating gradients of capacitance, defined as the change in relative water content relative to that of water potential (C = ΔRWC/ΔΨ) are shown. Therefore, temporal variation in remotely sensed metrics of VWC will be determined not only by temporal variation in Ψ, but by potentially large differences in the exchangeability of water in response to changes in Ψ across different plant tissues, and the response of sensor penetration depth to changes in water content
