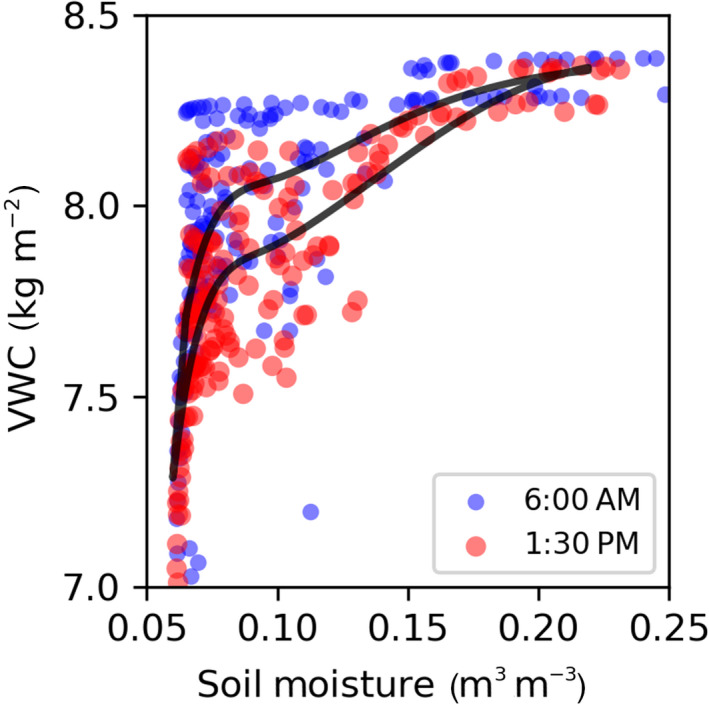
FIGURE 7.

Example phase diagram of simulated dynamics of VWC and root‐zone soil moisture content for a model test bed site in an Amazon moist forest using a hydraulics‐enabled terrestrial biosphere model (ED‐2.2‐hydro, Xu et al., 2021). The diurnal hysteresis (closed curves in black between VWC and soil water cannot be captured with traditional ecohydrological models that consider a single land surface water pool (n=1 in Figure 6). Such hysteresis can only be explained with a two(or more)‐pool framework (n>=2 in Figure 6), which further allows for inference of vegetation water uptake based on the timing and magnitude of the hysteresis
