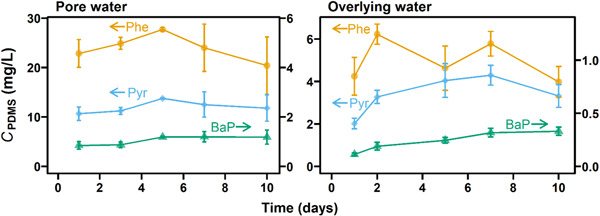
Figure 2.

Concentration–time curves for phenanthrene (yellow circles), pyrene (blue diamonds), and benzo[a]pyrene (green triangles) in polydimethylsiloxane fiber (Run 1; nominal sediment concentration, 5 mg/kg‐dry). Error bars represent standard deviations (n = 4–6). Left and right panels represent the data for porewater and overlying water, respectively. Arrows indicate the axes that the data refer to. PDMS = polydimethylsiloxane; Phe = phenanthrene; Pyr = pyrene; BaP = benzo[a]pyrene.
