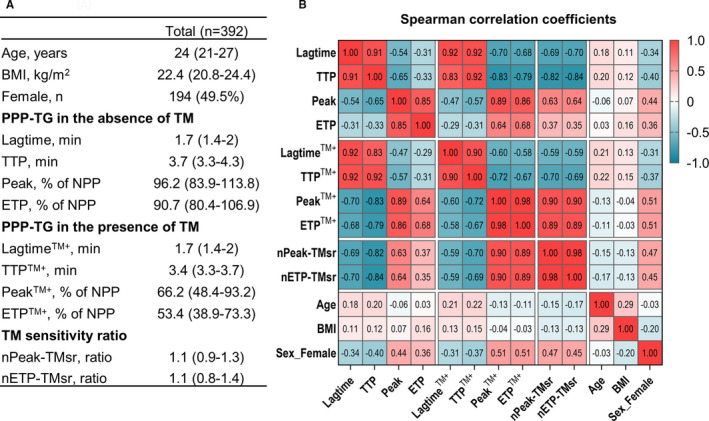
FIGURE 1.

Demographic and thrombin generation parameters of the cohort. A, Demographic and TG parameters of the cohort. Data are presented as number (percentage) or median (interquartile range). TG parameters, both in the absence and presence of TM, were normalized as the percentage of the TG parameters of NPP tested without TM in the same run. B, Spearman correlation coefficients between the TG parameters, markers of protein C pathway function (nPeak‐TMsr and nETP‐TMsr), and demographics. BMI, body mass index; ETP, endogenous thrombin potential; nETP‐TMsr, normalized sensitivity ratio of ETP to thrombomodulin; nPeak‐TMsr, normalized sensitivity ratio of peak to thrombomodulin; NPP, normal pooled plasma; TG, thrombin generation; TM, thrombomodulin; TTP, time to peak
