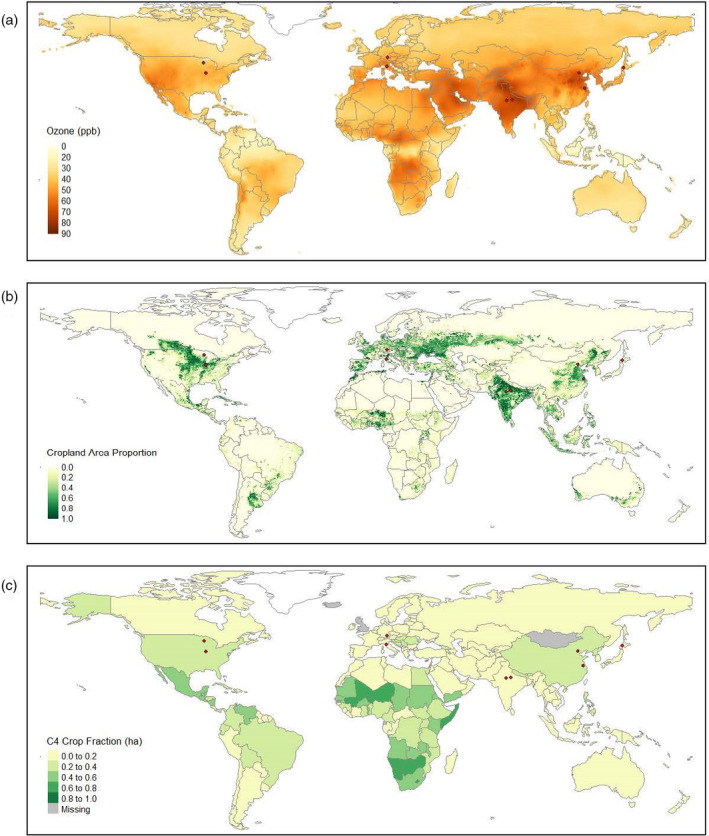
Figure 1.

(a) 2017 yearly tropospheric O3 distribution in parts per billion (ppb) at 0.1° resolution, calculated from combined surface O3 observations and a composite of nine atmospheric chemistry models (DeLang et al., 2021). (b) Global distribution of agricultural cropland in the year 2000 derived from remote land‐cover and agricultural inventory data (Ramankutty et al. 2000). (c) The fraction of total harvested area in hectares (ha) comprising C4 crop production in each country, obtained from 2010–2019 average global crop production data from the Food and Agriculture Organization of the United States (FAO). Red dots indicate the location of O3‐FACE experimental sites.
