
FIGURE 4.
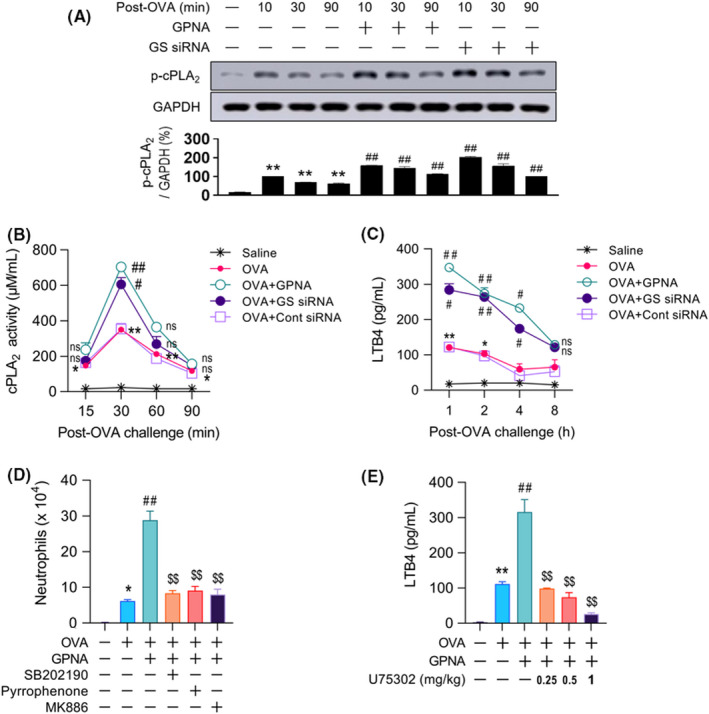
Association between the p38/cPLA2/LTB4 pathway and neutrophilia in Gln deficiency. (A–C) cPLA2 phosphorylation (A, n = 11, three independent experiments), activity (B, n = 10–15, three independent experiments), and levels of LTB4 in BALF from 1 to 8 h (C, n = 10–15, three independent experiments). (D) Number of neutrophils in BALF at 12 h. (E) Levels of LTB4 in BALF at 1 h post‐challenge (D and E, n = 15–18, three independent experiments). Data are presented as the mean ± SEM. ns p > .05 vs. saline control, *p < .05 vs. saline control, **p < .001 vs. saline control, #p < .05 vs. OVA group, ##p < .001 vs. OVA group, ns p > .05 vs. OVA + GPNA group, $p < .05 vs. OVA + GPNA group, $$p ≤ .001 vs. OVA + GPNA group. BALF, bronchoalveolar lavage fluid; cPLA2, cytosolic phospholipase A2; Gln, glutamine; GPNA, L‐γ‐glutamyl‐p‐nitroanilide; GS, glutamine synthetase; LTB4, leukotriene B4; ns, not significant; OVA, ovalbumin; SEM, standard error of the mean; siRNA, small interfering RNA