
FIGURE 5.
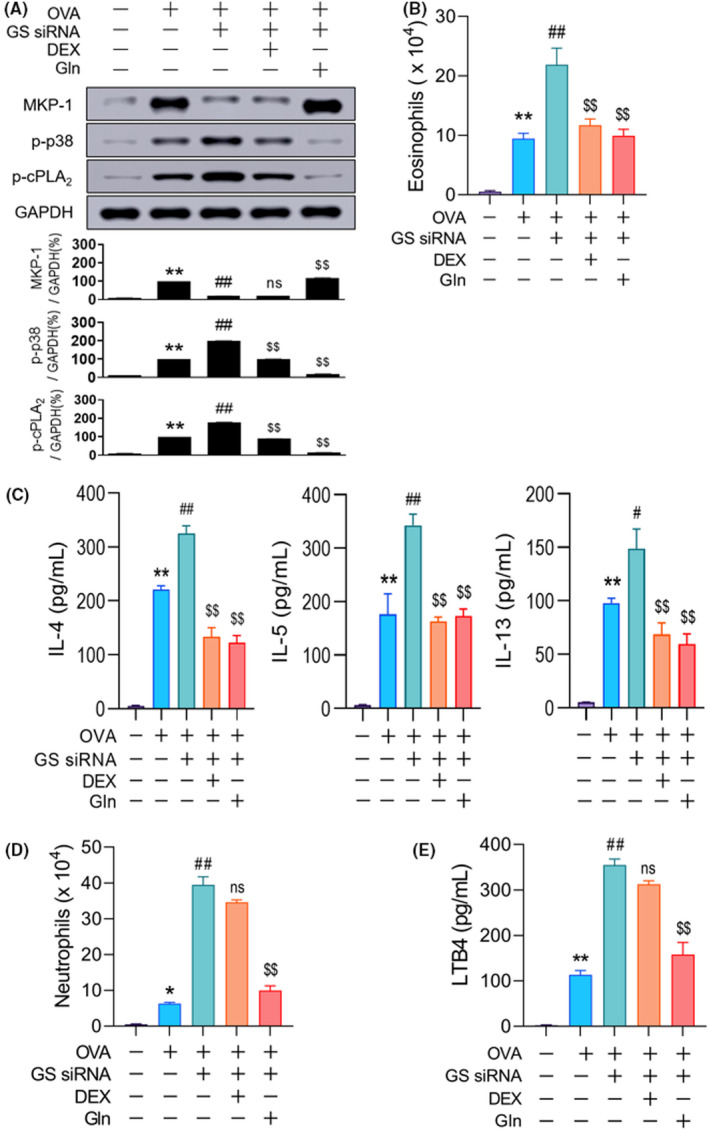
Steroid resistance of neutrophilia in Gln deficiency. (A) Representative immunoblots and densitometric analyses of MKP‐1 protein and phosphorylation of p38 and cPLA2 (n = 5–10, three independent experiments) at 1 h post‐challenge. (B–C) Number of eosinophils at 48 h (B, n = 10–15, three independent experiments) and Th2 cytokine levels at 18 h (C, n = 10–15, three independent experiments) in BALF. (D) Number of neutrophils in BALF at 12 h (n = 10–15, three independent experiments). (E) Levels of LTB4 in BALF at 1 h (n = 10–15, three independent experiments). A‐E, Gln (2 g/kg) was orally administered 30 min before the second airway challenge. Data are presented as the mean ± SEM. *p < .05 vs. saline control, **p < .001 vs. saline control, #p < .05 vs. OVA group, ##p < .001 vs. OVA group, ns p > .05 vs. OVA + GS siRNA group, $p < .05 vs. OVA + GS siRNA group, $$p < .001 vs. OVA + GS siRNA group. BALF, bronchoalveolar lavage fluid; cPLA2, cytosolic phospholipase A2; DEX, dexamethasone; GAPDH, glyceraldehyde 3‐phosphate dehydrogenase; Gln, glutamine; GS, glutamine synthetase; IL, interleukin; LTB4, leukotriene B4; MKP‐1, MAPK phosphatase‐1; ns, not significant; OVA, ovalbumin; SEM, standard error of the mean; siRNA, small interfering RNA