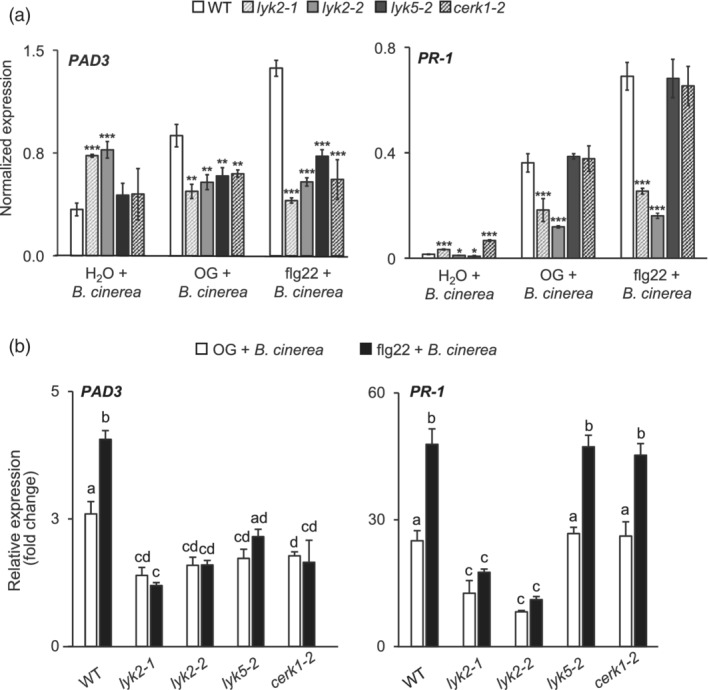
Figure 6.

Priming of pathogen‐induced PAD3 and PR‐1 expression in lyk mutants. Four‐week‐old WT, lyk2‐1, lyk2‐2, lyk5‐2 and cerk1‐2 plants were sprayed with water, 200 μg ml−1 OG or 1 μM flg22 and inoculated after 24 hr with a B. cinerea spore suspension. PAD3 and PR‐1 expression was measured 24 hr after inoculation by qRT‐PCR and normalized using UBQ5. (a) Bars represent mean expression ± SE (n = 3 biological replicates); asterisks indicate statistically significant differences between WT and mutants, according to Student's t‐test (*, p < .05; **, p < .01; ***, p < .001). (b) Mean expression fold‐change (± SE, n = 3 biological replicates), relative to water‐treated WT plants, of the same plants as in (a). Asterisks indicate statistically significant differences between WT and mutants, according to Student's t‐test (*, p < .05; **, p < .01; ***, p < .001). Different letters indicate statistically significant differences, according to one‐way ANOVA followed by Tukey's HSD test (p < .01). This experiment was repeated three times with similar results
