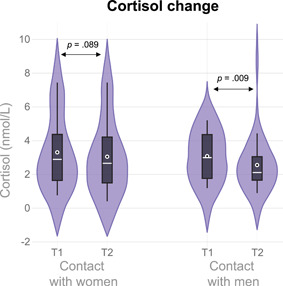
Figure 2.

Violin plot of the absolute cortisol levels per Moment and Condition. p Values refer to the comparisons made within the mixed model using the log‐transformed values. The plot used an Epanechnikov kernel, White circle = mean; white line = median [Color figure can be viewed at wileyonlinelibrary.com]
