FIGURE 4.

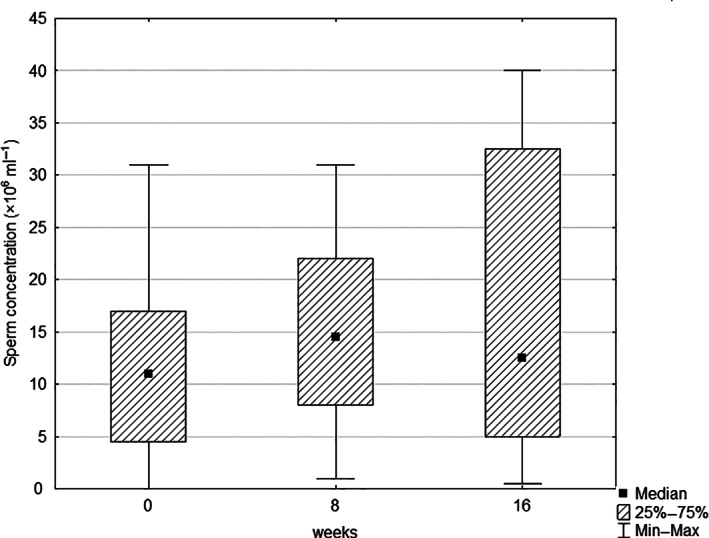
Box and whisker plot of the effect of maca treatment on sperm concentration (the median, the 25th and 75th percentiles, and the minimum and maximum observed values that are not statistically outlying)

Box and whisker plot of the effect of maca treatment on sperm concentration (the median, the 25th and 75th percentiles, and the minimum and maximum observed values that are not statistically outlying)