
FIGURE 1.
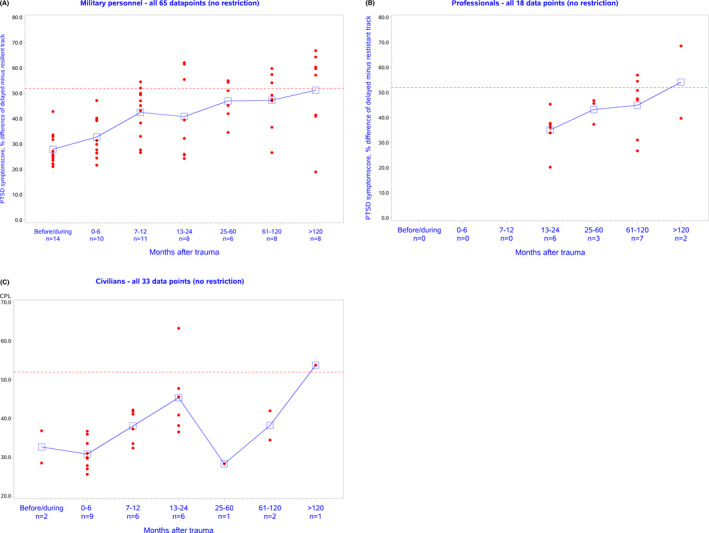
(A–C) Scatter plots and mean crude differences of PTSD symptom sumscore between delayed and low‐stable trajectories across follow‐up given as percentage of scale range. No restriction by level of homogeneity. Dotted line indicates level of probable PTSD. (A) Military personnel; (B) Professionals; (C) Civilians