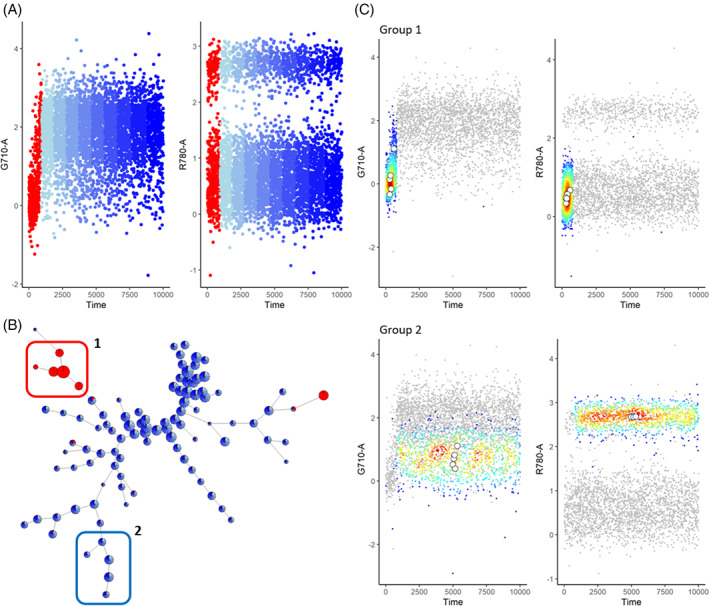
FIGURE 2.

Clustering of uncleaned sample with start‐up aberration. (A) Scatterplots of channels G710‐a and R780‐a where the time parameter is divided into 10 equal‐sized parts. The first part, with the aberrant signal, is colored red while the other parts are colored in different shades of blue. (B) FlowSOM analysis of the sample with 100 clusters. The pies are colored with the same color scheme as in A. (C) Scatter‐density plots of channels G710‐a and R780‐a for groups 1 and 2 indicated in B. The colored dots correspond to the events falling in the group while the gray dots show a random sampling of all events. These plots were made for the compensated, transformed file 147 of the FlowCAPIV dataset where the margin events were removed [Color figure can be viewed at wileyonlinelibrary.com]
